
What is SpecMap?
Using 8-band WorldView-2 satellite imagery, SpecMap provides spectral analysis of selected ice-free areas in the Transantarctic Mountains in preparation for the 2015-16 deep field logistics hub.
The data provided here are spectral indices that highlight compositional variability throughout the Central Transantarctic Mountains (TAM). The spatial resolution of these data (5 meters per pixel) is more than a factor of 50 times higher than the regional geologic mapping efforts completed in the late 1960s.
We are providing this product to the community in an effort to highlight the compositional and geological diversity surrounding the Shackleton Glacier region of the Central Transantarctic Mountains (83° S to 84° S and thirty degrees between 160° W and 170° E).
Investigators interested in utilizing the proposed 2015-2016 Shackleton Glacier deep field logistics hub (read more at TAM Science) are particularly encouraged to explore this dataset when proposing to the National Science Foundation. Please note that the data, spectral parameters, and web viewer were produced and assembled rapidly as to provide as much data as possible in a short timeframe.
Researchers interested in additional information, data availability, and other data options are encouraged to contact the investigators listed below. We would also greatly appreciate any comments and/or suggestions with regards to improvements to the web viewer or spectral parameterization.
Contact
- Dr. Mark Salvator, Lead Investigator
- University of Michigan
- msalva@umich.edu
Web Viewer
Data Description
We utilize the WorldView-2 satellite for this investigation, which was built and is operated by DigitalGlobe, Inc. WorldView-2 is capable of acquiring panchromatic and multispectral imagery at nominal spatial resolutions of 0.46 and 1.84 meters per pixel, respectively, although these resolutions may vary depending on viewing geometry.
The eight multispectral bands are located between 427 nm and 908 nm, and encompass most of the visible wavelength range and a portion of the near-infrared. These multispectral bands can be used to identify rocky surfaces, characterize ferrous and ferric iron-bearing compositions, and identify photosynthetic biological materials.
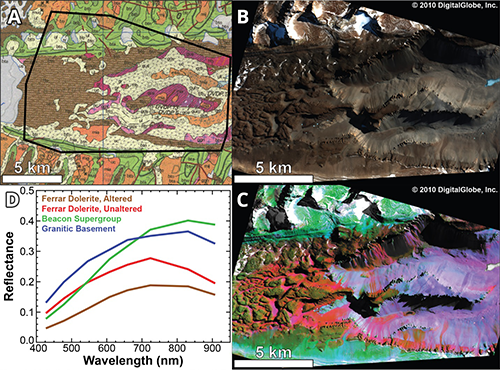
(a) Geologic map of Upper Wright Valley, McMurdo Dry Valleys, Antarctica (Cox et al., 2012). The location of the orbital image is outlined in black.
(b) Approximate true-color rendering of Nov. 5, 2010 WorldView-2 image (© 2010 DigitalGlobe, Inc.) of Upper Wright Valley.
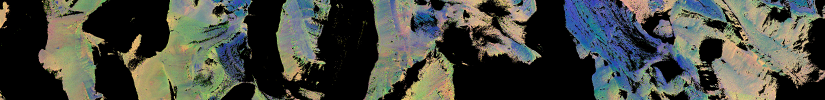
(c) Relative spectral variability (RSV) parameter rendering of Nov. 5, 2010 WorldView-2 image overlain on panchromatic imagery.
(d) Atmospherically corrected reflectance spectra derived from Nov. 5, 2010 WorldView-2 image. Spectra were derived from numerous locations within the image.
Methodology
The spectral indices shown here are designed to highlight relative spectral variability, or “RSV.” The RSV indices have been tested on ice-free areas in the McMurdo Dry Valleys, where the extensive lithological and compositional variability has been previously investigated on the ground, in the laboratory, and from orbital datasets (Fig. 1). The three parameters, mapped in the red, green, and blue channels, emphasize variations in the relative abundances of ferrous and ferric iron (Fig. 2). Areas influenced by ice, snow, clouds, and shadow were systematically removed from the images using their unique spectral signatures.
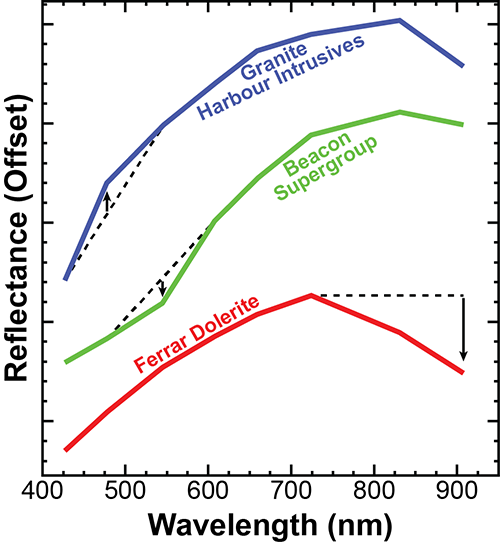
Visualization of the three (red, green, blue) spectral parameters. Spectra were derived from atmospherically-corrected Nov. 5, 2010 WorldView-2 image (© 2010 DigitalGlobe, Inc.)
The spectral interpretations discussed here are derived from this preliminary work, and requires additional ground truthing and laboratory measurements for confirmation. Additionally, we caution against the comparison of RSV signatures between different images. Inter-image variability can be the result of variations in atmospheric conditions, illumination and/or viewing geometry, and the incomplete removal of ice and/or shadows. As such, the relative variations between images must be interpreted with caution.
The strength of the broad 1000 nm absorption feature is mapped in red. Only the short wavelength wing of this absorption can be observed using WorldView-2, and so this parameter is built upon a ratio of the final WorldView-2 band (located at 908 nm) to the band centered at 724 nm. This absorption feature is the result of electronic absorptions in crystalline ferrous and ferric iron-bearing phases. Preliminary work indicates that this absorption is strongest in the pyroxene-rich Ferrar Dolerite and Kirkpatrick Basalts, while ferric iron-bearing species are less of a contributor.
The green and blue parameters capture the concavity of the spectrum between 427 nm and 608 nm, with the green parameter centered at 546 nm and the blue parameter centered at 478 nm. High green parameter values are indicative of a concave-up spectrum through this region, while high blue parameter values are indicative of a concave-down spectrum. In the McMurdo Dry Valleys, fine-grained sedimentary lithologies associated with the Beacon Supergroup often exhibited coatings enriched in ferric iron, resulting in a concave-up spectrum (high green parameter values). Alternatively, coarse-grained granites of the underlying Granite Harbour Intrusive group were more prone to physical alteration and lacked well-developed ferric iron coatings and rinds. As a result, the basement granites, granitoids, and metamorphic rocks typically exhibit a concave-down spectrum (high blue parameter values).
References
Salvatore, M. R., et al. “Characterization of spectral and geochemical variability within the Ferrar Dolerite of the McMurdo Dry Valleys, Antarctica: weathering, alteration, and magmatic processes.” Antarctic Science: 1-20. doi:10.1017/S0954102013000254.