
REMA
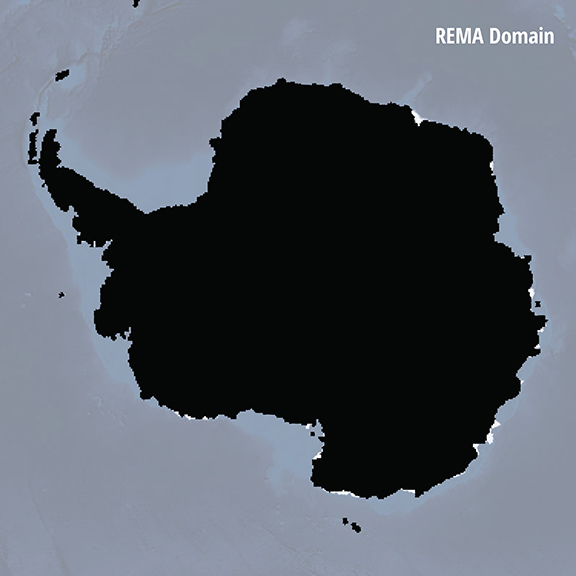
The Reference Elevation Model of Antarctica (REMA) is a high resolution, time-stamped Digital Surface Model (DSM) of Antarctica at 2-meter spatial resolution.
Want to jump right to the data?
We encourage you to read this page, but access links are provided below.
Want to stay updated?
Subscribe to our mailing list.
Overview
Purpose
The Reference Elevation Model of Antarctica (REMA) provides the first, high resolution (2-meter) terrain map of nearly the entire continent. Since each REMA grid point has a timestamp, any past or future point observation of elevation provides a measurement of elevation change.
REMA may provide corrections for a wide range of remote sensing processing activities, such image orthorectification and interferometry, and provide constraints for geodynamic and ice flow modeling, mapping of grounding lines, and surface processes. REMA also provides a powerful new resource for field logistics planning.
Source
REMA is constructed from hundreds of thousands of individual stereoscopic Digital Elevation Models (DEM) extracted from pairs of submeter (0.32 to 0.5 m) resolution Vantor satellite imagery, including data from WorldView-1, WorldView-2, and WorldView-3, and a small number from GeoEye-1, acquired between 2009 and 2024 over the austral summer seasons (mostly December to March).
Each individual DEM was vertically registered to satellite altimetry measurements from Cryosat-2 and ICESat, resulting in absolute uncertainties of less than 1 m over most of its area, and relative uncertainties of decimeters.
Processing
REMA is generated by applying fully automated, stereo auto-correlation techniques to overlapping pairs of high-resolution optical satellite images.
Using the open source Surface Extraction from TIN-based Searchspace Minimization (SETSM) software, developed by M.J. Noh and Ian Howat at the Ohio State University, stereopair images were processed to Digital Elevation Models using compute resources provided through an Innovation Allocation on the Blue Waters supercomputer located at the National Center for Supercomputing Applications at the University of Illinois at Urbana-Champaign.
Output
Output DEM raster files are being made available as both “strip” files as they are output directly from SETSM that preserve the original source material temporal resolution, as well as mosaic files that are compiled from multiple strips that have been co-registered, blended, and feathered to reduce edge-matching artifacts.
The time-dependent nature of the strip DEM files allows users to perform change detection analysis and to compare observations of topography data acquired in different seasons or years. The mosaic DEM tiles are assembled from multiple strip DEMs with the intention of providing a more consistent and comprehensive product over larger areas, while also providing a time stamp and error estimate for each pixel to enable to change detection. The tile data are registered to satellite altimetry to increase their absolute accuracy while strips are not. Registration data for strips may be provided in later REMA versions.
Documentation
Refer to these documents and guides for official REMA information & citation.
Citation
Along with acknowledging the PGC, the REMA dataset should be cited as follows:
Strips:
Howat, Ian, et al., 2022, “The Reference Elevation Model of Antarctica – Strips, Version 4.1”, https://doi.org/10.7910/DVN/X7NDNY, Harvard Dataverse, V1, [Date Accessed].
Mosaics:
Howat, Ian, et al., 2022, “The Reference Elevation Model of Antarctica – Mosaics, Version 2”, https://doi.org/10.7910/DVN/EBW8UC, Harvard Dataverse, V1, [Date Accessed].
Current Release
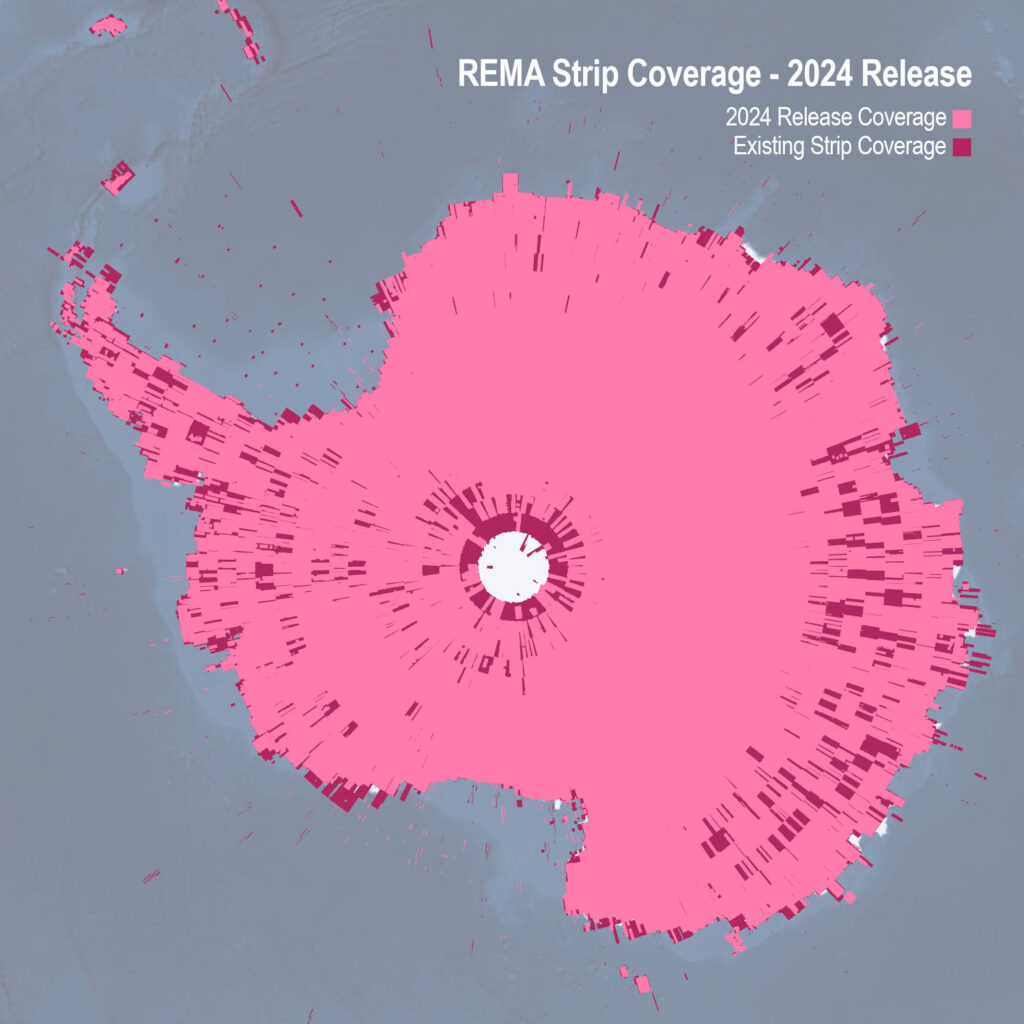
Annual DEM Strip Release – 2024
This release includes new strip DEMs from calendar year 2024 and before. The archive now includes strip DEMs from 2009-2024. This is the third annual DEM strip release under the Electro-Optical Commercial Layer (EOCL) contract to provide continued public access to historical and new digital elevation models in Antarctica and the Arctic (except Alaska).
See EOCL FAQ for more information
See PGCs DEM Product Guide for more information
STATISTICS
-
NEW STRIPS
- 63,227
-
RESTRICTIONS
- None
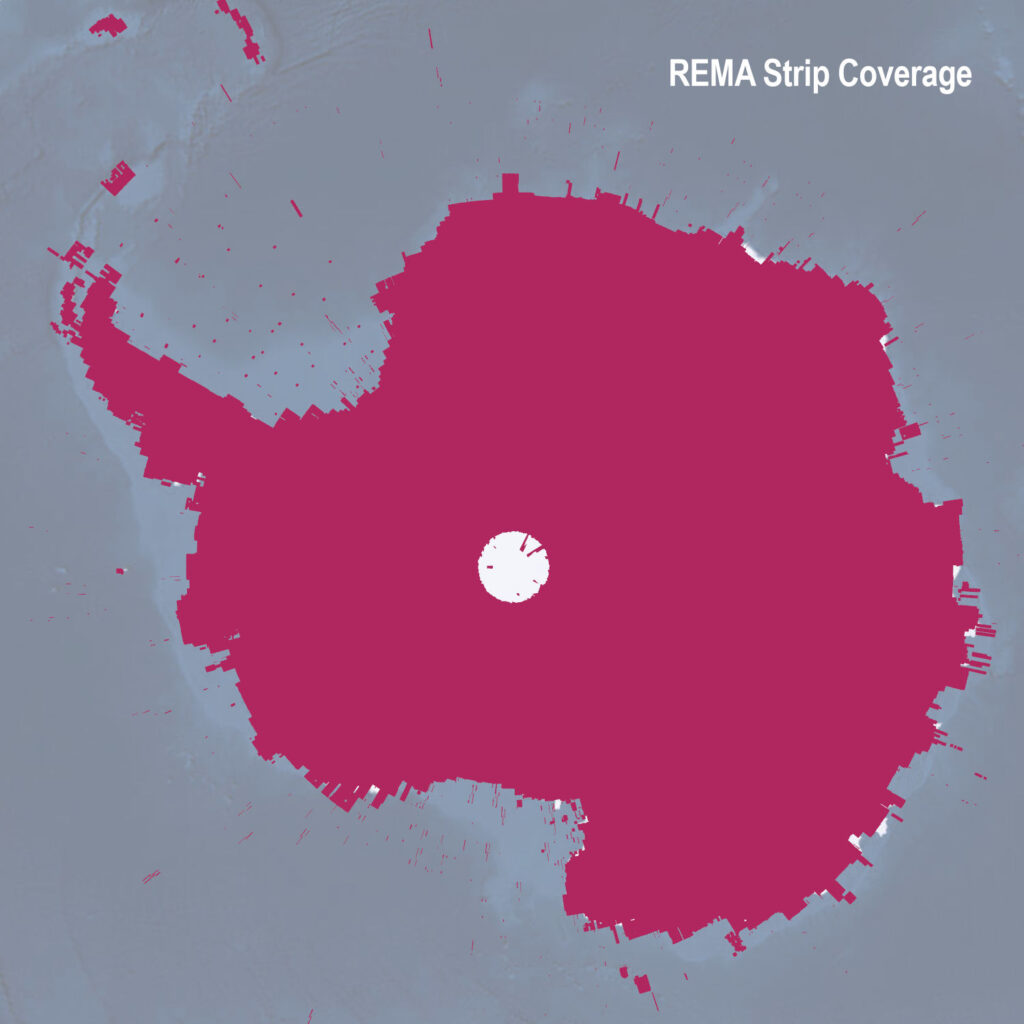
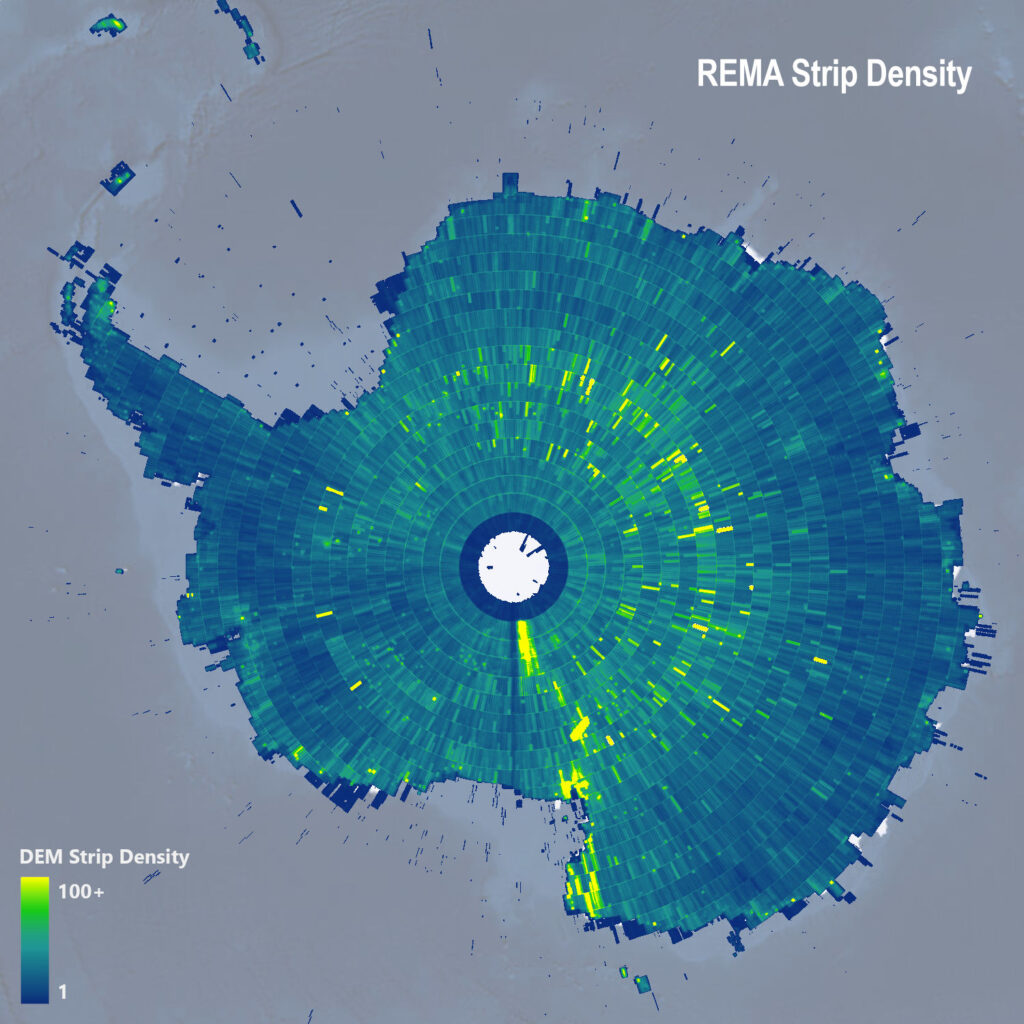
REMA Strips
Strip DEM files correspond to the overlapping area of the input stereoscopic imagery pair strips as they are collected by Vantor’s constellation of polar-orbiting satellites. Strip DEM dimensions will vary according to the satellite sensor that acquired the images and the off-nadir angle of collection. Most strips are between 13 km and 17 km in width, and 110 km and 120 km in length.
Strip DEM files are provided at 2-meter resolution in 32-bit GeoTIFF format. Elevation units are meters and are referenced to the WGS84 ellipsoid. No ground control or altimetry registration has been applied to the strips.
As of July 2023, an exception to EOCL contract allows for continued public access to historical and newly created REMA data. For more information about the current license, check out our EOCL FAQ.
STATISTICS
-
TOTAL STRIPS
- 442,597
-
TOTAL STRIP DEM FILE SIZE
- 171 TB
-
STRIP DEM DATES
- 2009-2024
DATA EXTENT
REMA Strip DEM extent index
( SHP | GDB | GPKG | PARQUET )
DATA ACCESS
Browse REMA Strip DEMs hosted at PGC
Browse Static STAC Catalog with AWS links
Dynamic STAC API Guide
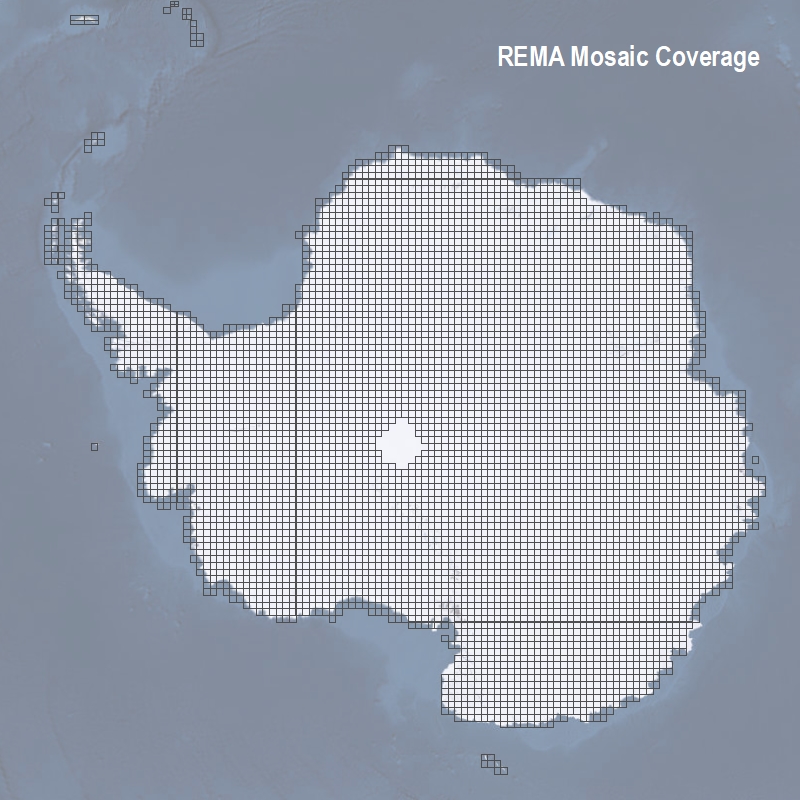
REMA Mosaic
Version 2 Mosaic
Mosaicked DEM files are compiled from the entire stack of strip DEMs as source data. The height value for each pixel in the mosaic is derived from the median value of all contributing strip DEMs, in an effort to extract a consistent surface with low sensitivity to outlying height values. As a result the REMA mosaics include DEMs from austral summer season where the sun elevation is sufficiently high to acquire satellite imagery.
Mosaicked DEM files are distributed at full 2-meter spatial resolution as 50 km x 50 km tiles in 32-bit GeoTIFF format. Reduced resolution versions are also available at 10-meter and 32-meter as 100 km x 100 km tiles, and full-domain 100-meter, 500-meter, and 1-kilometer mosaics. Elevation units are meters and are referenced to the WGS84 ellipsoid.
STATISTICS
-
Version 2 – TOTAL MOSAIC TILES (2m)
- 5,801
-
TOTAL MOSAIC TILE FILE SIZE
- 8.4 TB
DATA EXTENT
REMA Mosaic DEM extent index
( SHP | GDB | GPKG | PARQUET )
REMA Mosaic DEMs available at multiple resolutions
Browse Static STAC Catalog with AWS links
Dynamic STAC API Guide
Explore Data
Important information regarding the data explorer applications:
DEMs provided by PGC are relative to the WGS84 ellipsoid, whereas the Esri services have transformed those values to be in geoidal/orthometric heights, also referred as Mean Sea Level (EGM08).
There is no login required for the following apps. Users with active NSF-OPP funding for Antarctic research can access and request data (including source imagery) from PGC.
Any download or use of REMA data from the app (or otherwise), must adhere to PGC’s Acknowledgement Policy.
PGC Fridge Data Portal
The PGC Fridge data portal is the best way to preview and download the original datasets (ellipsoidal heights) if no GIS or remote sensing software is available. Users can directly download or choose from a list of DEM products including: full-resolution data, hillshades, masks, metadata, and more. Users with active NSF-OPP funding for Antarctic research may access source imagery via Commercial Satellite Imagery login.
PGC STAC Catalog Access
STAC (Spatio Temporal Asset Catalog) is a standard for organizing geospatial data. REMA’s Static STAC Catalog lets you browse the collection and download assets individually. The Dynamic STAC API facilitates programmatic data queries using python, R, etc.
OpenTopography Portal
The OpenTopography Portal platform provides additional tools for visualization and processing, unlike other access points. DEMs of 32m and 10m resolution data products are open to all users while 2m resolution data products are restricted to education and research users. Queries are limited to 2000 sqkm but include Arc ASCII Grid files, GeoTIFFs, and IMGs with a variety of raster visualization options. Datasets are available in the the original datasets (ellipsoidal heights) for delivery.
Esri REMA Explorer
The Esri REMA Explorer is the best way to preview datasets of geoidal/orthometric heights (Mean Sea Level) if no GIS or remote sensing software is available or you simply want to explore the entire dataset quickly. The full-resolution mosaics are presented in this web map to quickly preview and explore the elevation data. With this web map, users can visualize the REMA data, preview the spatial coverage, and download simple exports. This viewer allows maps to be made, distances to be measured and images to be exported. The shaded relief is optimized to enhance the texture of the ice.
Download from PGC
REMA Strip DEM extent index – with data download links (SHP | GDB | GPKG | PARQUET)
REMA Strip DEM data download via HTTP (browser): https://data.pgc.umn.edu/elev/dem/setsm/REMA/strips/latest/2m
REMA Mosaic DEM extent indexes – with data download links (SHP | GDB | GPKG | PARQUET)
REMA Mosaic DEM data download via HTTP (browser): https://data.pgc.umn.edu/elev/dem/setsm/REMA/mosaic/latest
Bulk Download
Use the links below to browse the directory for the entire REMA dataset. Refer to the User Documentation to see the directory structure, naming schemes, and download contents.
HTTP: https://data.pgc.umn.edu/elev/dem/setsm/REMA
Users familiar with the GNU Wget utility can use the following commands to batch download REMA data. There is also a Windows version.
Please note, the first two commands will download the entire dataset, which is over 200 TB for strips and 20 TB for mosaics. Use the subdirectory examples to limit your download.
2-meter strips (entire dataset!)
wget -r -N -nH -np -R index.html* --cut-dirs=3 https://data.pgc.umn.edu/elev/dem/setsm/REMA/strips/s2s041/2m/
2-meter mosaic tiles (entire dataset!)
wget -r -N -nH -np -R index.html* --cut-dirs=3 https://data.pgc.umn.edu/elev/dem/setsm/REMA/mosaic/v2.0/2m/
2-meter strips (subdirectory example)
wget -r -N -nH -np -R index.html* --cut-dirs=3 https://data.pgc.umn.edu/elev/dem/setsm/REMA/strips/s2s041/2m/s72e155/
2-meter mosaic tiles (subdirectory example)
wget -r -N -nH -np -R index.html* --cut-dirs=3 https://data.pgc.umn.edu/elev/dem/setsm/REMA/mosaic/v2.0/2m/18_28/
Download from AWS
Strip DEMs available at 2-meter resolution.
All publicly-available DEM data from our projects are also hosted in an open AWS bucket and indexed with a STAC catalog. DEM data assets can be identified using the DEM STAC items and downloaded or used directly in the cloud.
REMA AWS Open Data Registry page:
Download from OpenTopography
OpenTopography is distributing the REMA mosaics (version 2, released October 2022) with value-added tools for access, processing, and visualization.
32m and 10m resolution data products are open to all users.
2m resolution data products are restricted to education and research users.
OpenTopography REMA page:
VRTs
Users can directly load the mosaic tiles into certain GIS programs and applications without downloading data by using GDAL’s Virtual Format.
REMA VRT files representing 2, 10, and 32-meter resolution mosaics:
Reference these VRTs in the cloud from your GIS or application or download them locally. Note they can be slow to load initially.
Web Services & Applications
Need help connecting to web service layers? Check out PGC’s guide to using web services in ArcGIS and QGIS to get you started.
REMA 2m Strip Index
REMA 2m Tile Index
REMA Mosaic-only Image Service:
REMA composite (strip and mosaic) Image Service
-
- REST Endpoint: https://di-pgc.img.arcgis.com/arcgis/rest/services/rema_rel2210/ImageServer
- ArcGIS Online Item: https://umn.maps.arcgis.com/home/item.html?id=c7146f29d7e54c8bb00a7ec7d8ea47b6
- WMS Service: https://di-pgc.img.arcgis.com/arcgis/services/rema_rel2210/ImageServer/WMSServer
- WCS Service: https://di-pgc.img.arcgis.com/arcgis/services/rema_rel2210/ImageServer/WCSServer
Maps
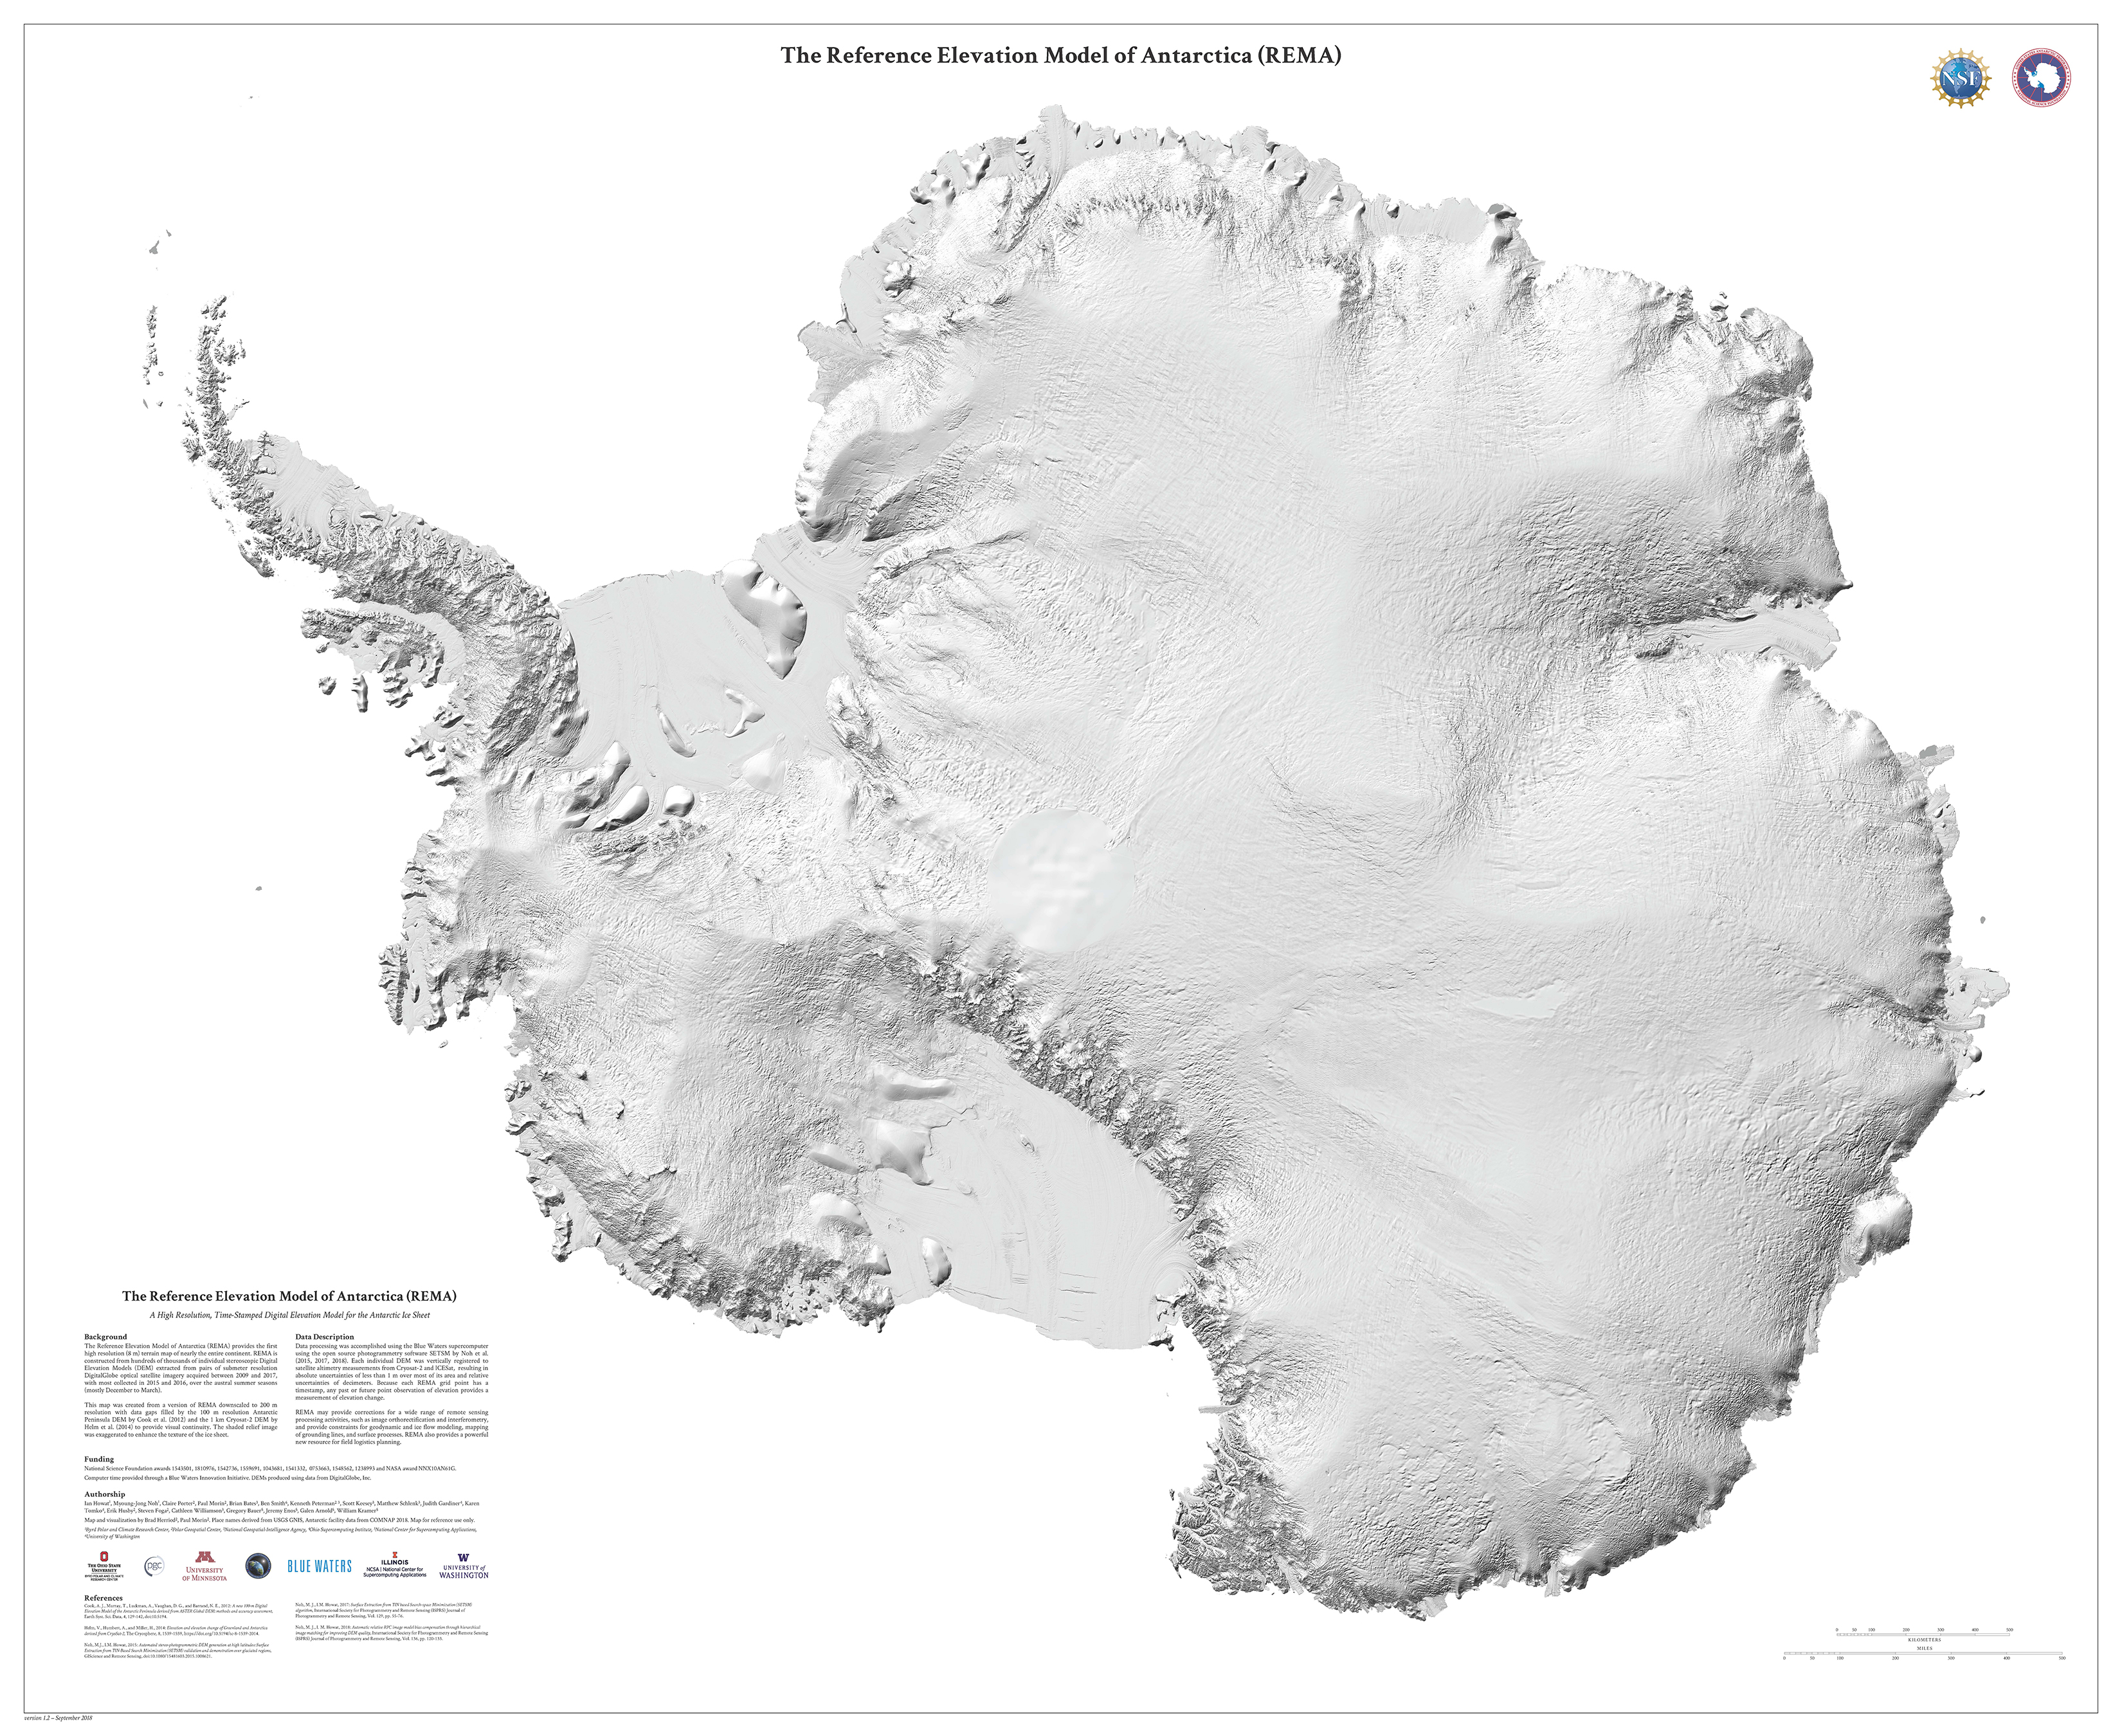
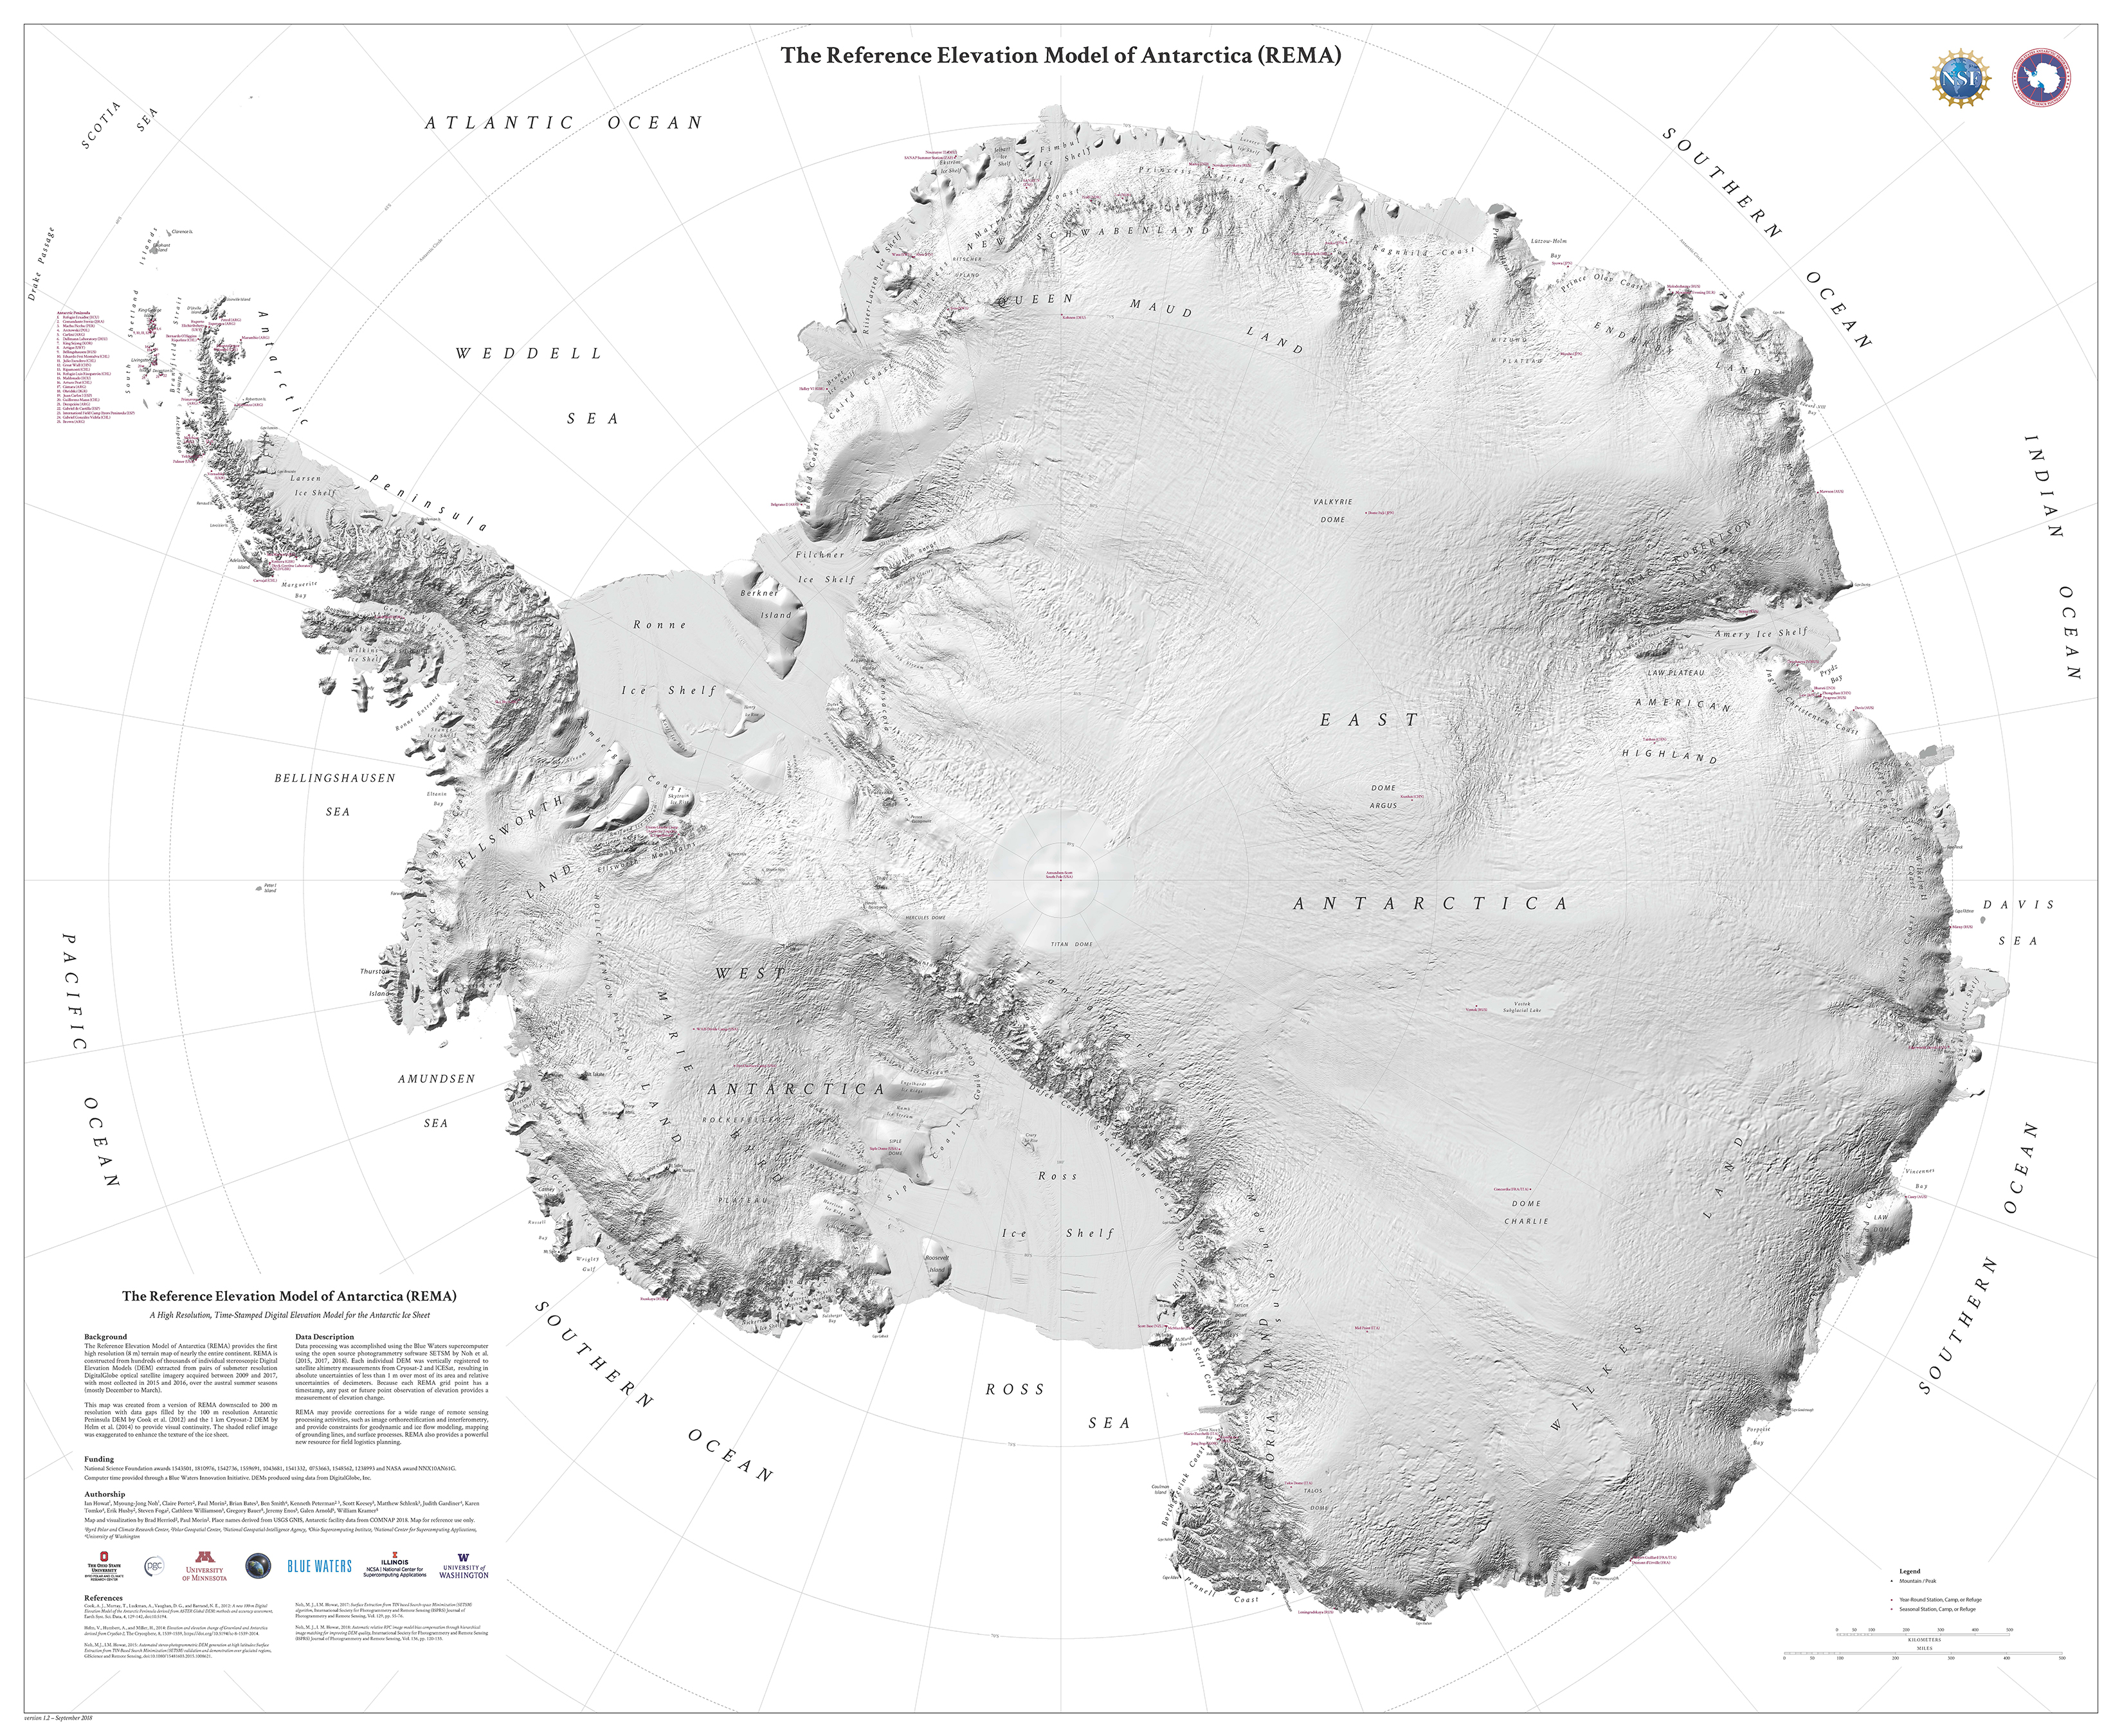
Map Poster
A shaded relief map poster of the REMA dataset with voids filled and the resolution reduced to 500 meters is available as a 44″x36″ map poster. There are two versions, one that contains cartographic elements such as place name labels, graticules, and facilities, and one that is just the shaded relief image. The maps can be downloaded below.
Shaded Relief Version
Cartographic Version
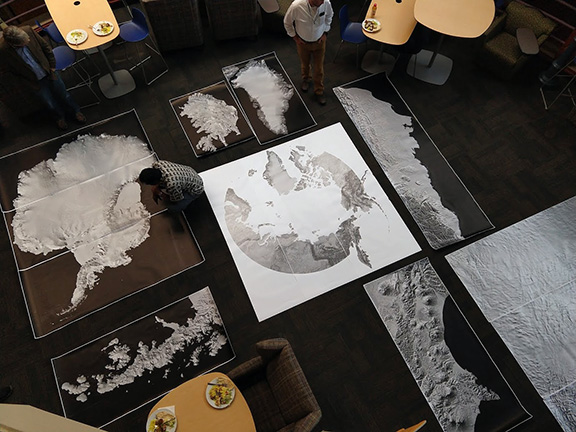
Large-Format Prints
If the above format isn’t large enough for you, a number of high-resolution images have been created to be printed on a large-format plotter for display on a floor or a large wall. The full continent of Antarctica is available as three strips sized at 36″x132″ with a final size of 9’x11′ when fully assembled. The Antarctic Peninsula and the Thwaites/Pine Island Glacier area of West Antarctica are also available.
All files are downloadable with the links below in .jpg format. Please note: file sizes may be up to 50 Mb.
- Antarctica: Strip 1, Strip 2, Strip 3
- Antarctic Peninsula: Strip 1
- Thwaites / Pine Island Glaciers: Strip 1, Strip 2, Strip 3
Press
Video
- GEOINT Symposium 2019: Keynote: Vice Admiral Robert Sharp, NGA Director (6/3/2019)
- KARE11 News: U of M scientists create first high-res map of Antarctica (9/18/2018)
- Ideastream: Rick Jackson interviews REMA Principal Investigator Dr. Ian Howat (9/12/2018)
- FOX9 News: University of Minnesota helps develop most accurate map of Antarctica terrain (9/4/2018)
- Byrd Polar and Climate Center: Ian Howat discusses the ArcticDEM and REMA Projects (2/12/2018)
Audio
Dr. Ian Howat, the REMA Principal Investigator and Professor of Earth Sciences at Ohio State University, was featured in BBC Newsday episode Russia Gears Up for Biggest War Games Since Cold War. If the audio fails to load, you can listen to the original broadcast at this link: https://www.bbc.co.uk/radio/play/w172w1fpjz11zwf/ (9/11/2018)
Length: 3:48
Articles
- NCSA: Blue Waters and Advanced Visualization Lab Co-Produces Award-Winning Documentary “Atlas of a Changing Earth” (12/1/2021)
- Trajectory Magazine: Polar GEOINT (4/29/2019)
- The Cryosphere: The Reference Elevation Model of Antarctica (02/26/2019)
- Esri: High Fidelity Polar Elevation (10/29/2018)
- Antarctic Sun: Researchers Release The Highest Resolution Antarctic Map Ever Produced (10/17/2018)
- Focus.it: Questa mappa dell’Antartide è la più dettagliata mai ottenuta per un continente (9/14/2018)
- Publico.pt: Eis o mapa mais detalhado da Antárctida (9/12/2018)
- Interia.pl: Stworzono najdokładniejszą mapę Antarktydy w historii (9/12/2018)
- N+1.ru: N+1.ru: Ученые составили самую детальную карту Антарктиды (9/10/2018)
- RzeczpospoliteJ.pl: Dotychczas mieliśmy lepsze mapy Marsa niż Antarktydy (9/10/2018)
- Tekniikan Maailma.fi: Etelämantereesta tuli juuri kaikkein tarkimmin kartoitettu manner (9/10/2018)
- National Geographic Russia: Создана подробнейшая карта Антарктиды (9/10/2018)
- Newsweek: “You Can See Almost Everything”: New Map of Antarctica is Highest Resolution of Any Continent on Earth (9/10/2018)
- New York Post: Scientists create most detailed map of Antarctica ever (9/10/2018)
- Mother Nature Network: New high-resolution map of Antarctica shows the continent in incredible detail (9/10/2018)
- GIS Lounge: Highest Resolution DEM of Antarctica Released (9/10/2018)
- IFL Science: This Is The Best Terrain Map of Antarctica Ever Created (9/10/2018)
- Tech Times: Scientists Unveil the Most Complete and Accurate Map of Antarctica Ever Made (9/10/2018)
- Live Science: New High-Res Map of Antarctica Shows the Icy Continent in Astonishing Detail (9/10/2018)
- El Espectador: Crean un nuevo mapa que revela los secretos más íntimos de la Antártida (9/9/2018)
- Daily Galaxy: ‘A Game Changer’ – Stunning New Map of Antarctica’s Warming World: ‘Until Now, We’ve had Better Maps of Mars’ (9/9/2018)
- Fortune: ‘You Can See Almost Everything’: Antarctica Just Became the Best-Mapped Continent on Earth (9/8/2018)
- Gazete Yeniyuzyil: Antarktika Kitasinin En Detayli Haritasi Yayinlandi (9/8/2018)
- Daily Mail: Antarctica as you’ve never seen it before: Scientists release the most accurate, high-resolution terrain map ever created (9/7/2018)
- Gizmodo Earther: New Super-High-Resolution Shows Antarctica in Unprecendented Detail (9/7/2018)
- USA Today: New Map of Antarctica Shows the Icy Continent in ‘Stunning Detail’ (9/7/2018)
- New York Times: New Antarctica Map Is Like ‘Putting on Glasses for the First Time and Seeing 20/20’ (9/7/2018)
- Planeta Incognito: Investigadores Lanzan El Mapa Más Preciso Del Relieve De La Antártida (9/5/2018)
- National Geospatial-Intelligence Agency: NGA Imagery, Expertise Critical to the First High-Res Antarctica Map (9/5/2018)
- The Ohio State University: A terrain map that shows Antarctica in stunning detail (9/4/2018)
- University of Minnesota: Researchers release the most accurate map of Antarctica terrain (9/4/2018)