
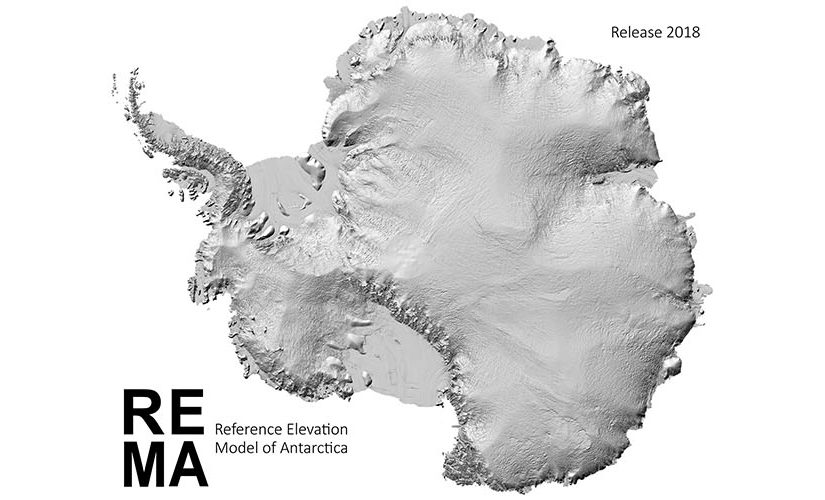
The REMA team is proud to announce the release of the Reference Elevation Model of Antarctica. REMA provides the first high resolution (8-meter), high accuracy terrain dataset of approximately 98% of the contiguous continental landmass of Antarctica extending to 88°S.
overview
REMA is constructed from hundreds of thousands of individual stereoscopic Digital Elevation Models (DEM) extracted from pairs of submeter resolution DigitalGlobe satellite imagery licensed by the National Geospatial-Intelligence Agency, including data from WorldView-1, WorldView-2, and WorldView-3 acquired between 2009 and 2017, with most collected in 2015 and 2016.
REMA is generated by applying fully automated, stereo auto-correlation techniques to overlapping pairs of high-resolution optical satellite images using the open source Surface Extraction from TIN-based Searchspace Minimization (SETSM) software, developed by M.J. Noh and Ian Howat at the Ohio State University. The images are processed to Digital Elevation Models using compute resources provided through an Innovation Allocation on the Blue Waters supercomputer located at the National Center for Supercomputing Applications at the University of Illinois at Urbana-Champaign.
This release consists of an 8m posting mosaic that are compiled from multiple strip DEMs that have been co-registered, blended, and feathered to reduce edge-matching artifacts and the collection of time-stamped DEM strips.
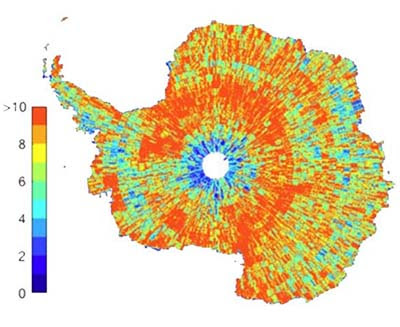
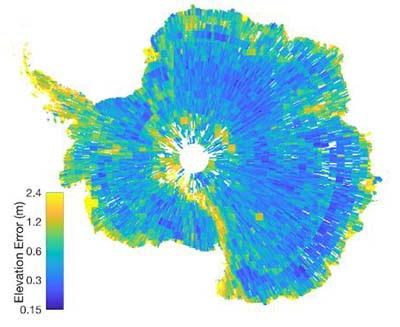
The time-dependent nature of the strip DEM files allows users to perform change detection analysis and to compare observations of topography data acquired in different seasons or years. The mosaic DEM tiles are assembled from multiple strip DEMs with the intention of providing a more consistent and comprehensive product over larger areas, while also providing a time stamp and error estimate for each pixel to enable change detection. The tile data are registered to satellite altimetry to increase their absolute accuracy while strips are not.
Project overview, methodology, web services, and download options can be found on the PGC website at https://www.pgc.umn.edu/
EXPLORE DATA
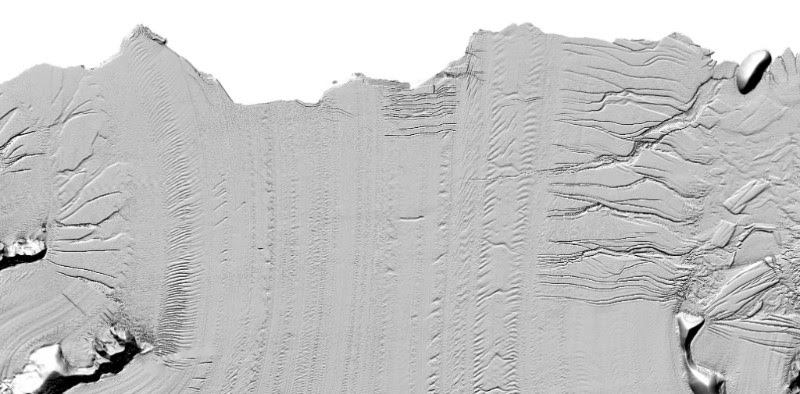
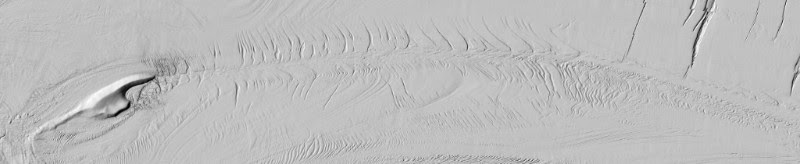
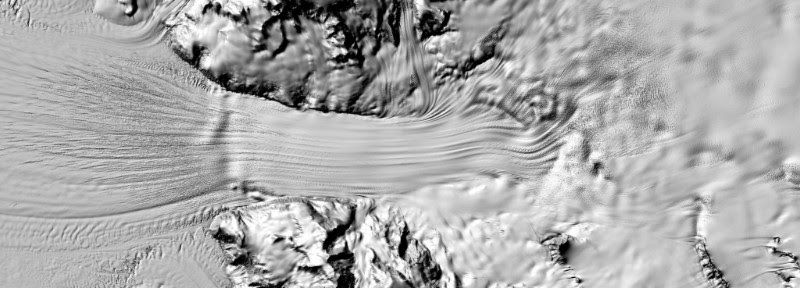
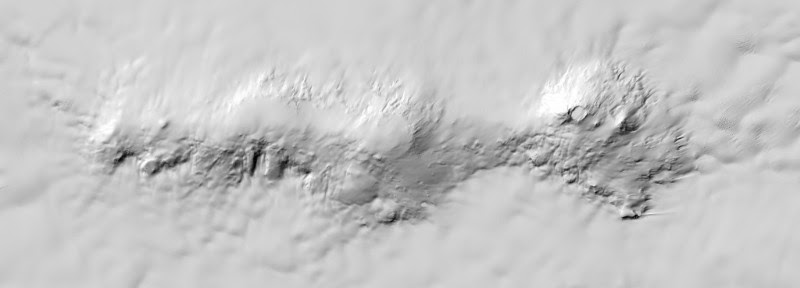
Esri has developed an online web mapping application to explore REMA data. The REMA Hillshade Viewer allows maps to be exported, distances to be measured and images to be exported. The shaded relief is optimized to enhance the texture of the ice. Best of all, you can zoom to a location and create a map link that you can send to your friends and colleagues.
GALLERY
STAY UPDATED
Click here to subscribe to occasional PGC Elevation updates via email.
Read the original PGC Newsletter post here.