
In this guide
Introduction to Satellite Imagery
Last Updated: October 4, 2023

Imaging the Earth from space: history, technology and terminology of satellite-based remote sensing.
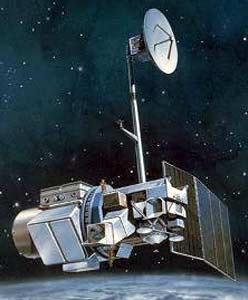
Earth Observation
The planet is continually being observed and imaged by satellites.
Before 1972, satellites weren’t designed to study or monitor Earth’s surface. Instead, they were mainly used for military missions. Imagery was commercialized in 1984, but faced many funding issues.
This led to the passing of the Land Remote Sensing Policy Act of 1992. The new law embraced the value of remote sensing technology, promoted research and public sector applications, and allowed commercial companies to launch satellites and sell imagery.
As a result, Earth observation satellites specifically intended for non-military applications were designed for long-term global observations of the land surface, oceans, biosphere, and atmosphere.
Satellite instruments became equipped to measure vegetation coverage, sea-ice fluctuation, sea level and sea surface temperatures, concentrations of atmospheric gases, and many others. These observations are applied to meteorological forecasting, environmental monitoring, disaster monitoring, and cartographic purposes.
Over 2,200 satellites orbit Earth today, and the space landscape is rapidly changing. Commonly-used satellites are both from commercial to government-sponsored and include WorldView, QuickBird, IKONOS, Landsat, MODIS, AVHRR, TRMM, and many others sponsored by many different companies and nations.
Spectral Capabilities, Resolution, and Frequency
Satellites extract information from energy interacting with the Earth’s surface.
Remote sensing sensors measure the electromagnetic radiation from reflection, emission, and emission reflection.
Light acts as a wave that can be described by its wavelength and frequency, comprising the electromagnetic spectrum. Longer wavelengths contain less energy and shorter wavelengths contain more.
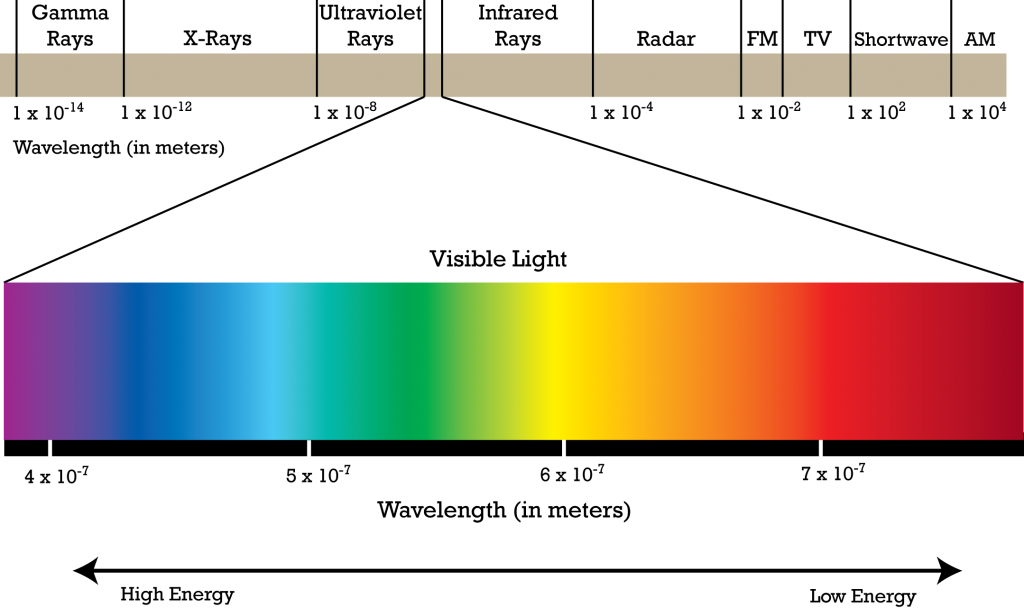
The electromagnetic spectrum is broad and not all wavelengths are equally effective nor significantly interact with surfaces of interest for remote sensing purposes.
Ranges of the electromagnetic spectrum used in remote sensing encompass the following wavelengths:
Visible
- Blue: 0.4 – 0.5 µm
- Green: 0.5 – 0.6 µm
- Red: 0.6 – 0.7 µm
Near-infrared
- 0.7 – 1.2 µm: Distinguishes green vegetation well
Mid-infrared
- Shortwave infrared (SWIR): 1.2 – 3 µm estimates soil and vegetation moisture well
- 3 – 8 µm detects high temperature sources well
Spatial resolution refers to the size of the area on the ground that is summarized by one data value in the imagery, typically expressed as pixel size in raster data.
Spectral resolution is the number and width of the spectral bands that the satellite sensor detects.
Satellites in orbit observe the same point on earth in regular intervals, known as revisit times. These times vary depending on orbit, altitude, location, swath, etc. and are crucial for time-series analysis and detecting change.
Sensors are equipped with different imaging systems: whiskbroom (cross-track) scanners and pushbroom (along-track) scanners.
Whiskbroom scanners move in the direction of the orbital track while scanning across-track with a mirror. This results in a wide swath width and resolution varying with scan angle and can cause pixel distortion. Common whiskbroom scanners include Landsat MSS/TM/ETM+ and AVHRR.
Pushbroom scanners move in the direction of the orbital track while scanning along-track without any mirror. This results in a narrower swath width and no pixel distortion. Pushbroom scanners are preferred for high spatial resolution sensors and include Landsat 8, QuickBird, and IKONOS.
Scientific Applications
Satellite imagery has many advantages for scientific users, such as obtaining global views, multi-scale observations, frequent observations, direct and non-destructive observations, complete cover, and even non-visible spectral characteristics.
The enormity of imagery coverage across space and time has also allowed an emerging application of crowdsourcing, enlisting citizen scientists (like you!) to tag images to identify phenomena.
Because of these significant advantages, a breadth of applications have emerged. Examples of scientific applications of satellite imagery include:
Change Detection
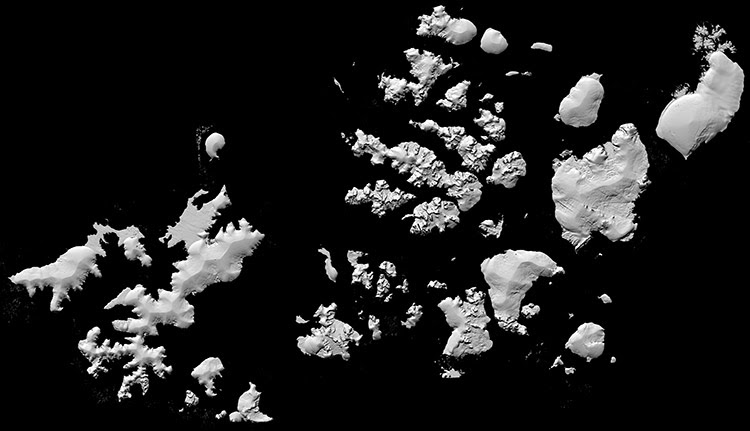
The polar regions consist of extreme geography and climate, have complex ecosystems, and experience change like nowhere else in the world.
PGC maps these remote places and recently produced a high-resolution, high-quality, digital elevation model of the Arctic using optical stereo imagery.
PGC’s ArcticDEM is a response to the high demand for accurate tools to measure topographic change and its many impacts in the Arctic.
Related Guide: Introduction to Stereoscopic Imagery
Image Classification
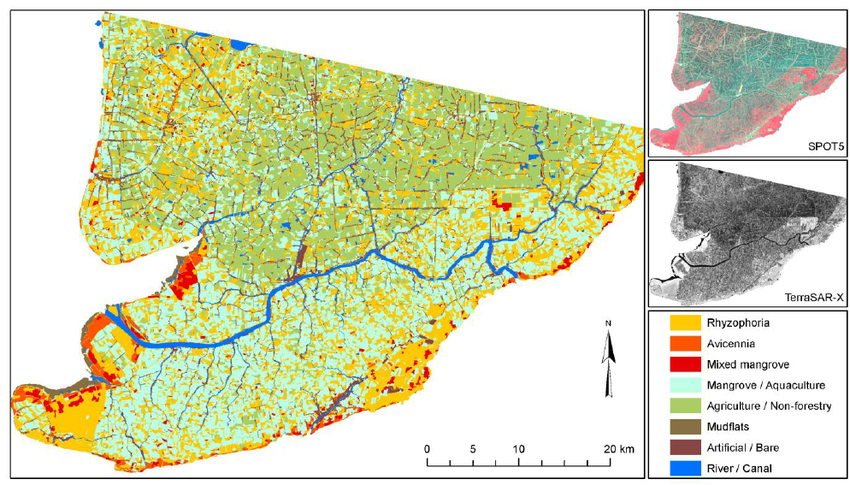
A frequently-used method for information extraction from remote sensing data is to match information classes of to spectral ranges (or a combination of spectral ranges).
Land cover and land use maps, such as those classifying mangroves from SPOT and TerraSAR-X imagery in the Mekong Delta, provide a greater understanding of environments and their processes.
Risk Assessment
Initiatives like the Mapping Malaria Risk in Africa project (MARA/ARMA) have produced maps of climate suitability for Malaria transmission by characterizing the conditions of the disease necessary for transmission and correlating them with key climatic variables observed from remotely sensed imagery.
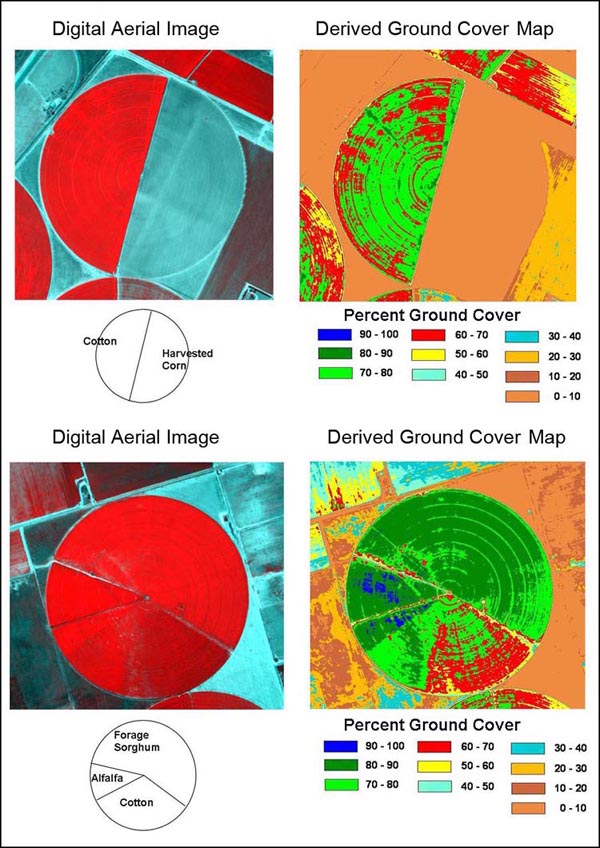
Agriculture
High spatial resolution, false color composites acquired from TTAMRSS (a multispectral, airborne remote sensing system) helped farmers and agricultural consultants in Texas plan different crop and yield management practices.
Natural Resource Management
AVHRR, MODIS, and SPOT sensors quantitatively measure, for one, the gain and loss of our global forests.
From this data, scientists gauge forest stand areas and estimate valuable forest resources like wood, food, medicine, and absorption of carbon dioxide.
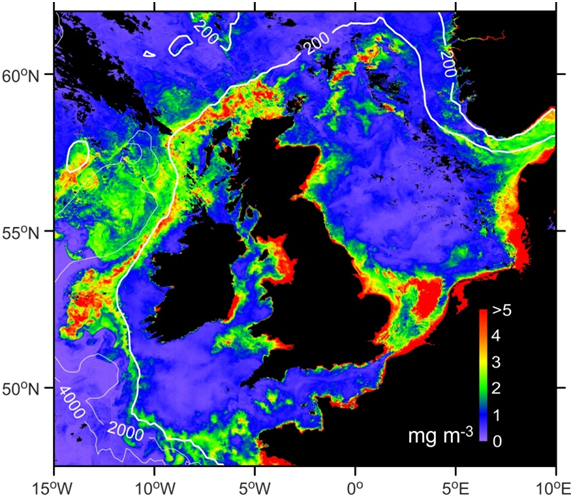
Coastal and Marine
Sea shelf ecosystems help control our climate and supply food. The National Oceanography Centre (NOC) measured phytoplankton, the microscopic marine plants at the heart of the marine food chain, as a key indicator of the productivity of an ocean area all from space.
Urban Geography
The conflict in Syria is characterized by violations of human rights and defiance of international law. The Syrian government has demolished neighborhoods suspected of supporting opposition forces.
Scientists used Landsat imagery and its historical archive to monitor and document the destruction of conflict-affected urban environments.
Source: A. Marx, Claremont Graduate University
Emergency Management and Response
Online communities such as OpenStreetMap, Tomnod, CrisisMappers, Virtual Disaster Viewer, and Google MapMaker are utilizing remotely-sensed imagery to provide support in disaster preparedness and emergency response.
Terminology
Below is a list of commonly used satellite imagery terms and definitions.
Many items in this list are specifically relevant to the commercial satellite imagery that PGC provides and parameters we use for defining collection, processing, or output.
Related Guide: Imagery Processing Options
-
Radiometric Correction
- The process of removing the effects of the atmosphere on the reflectance values of images taken by satellite or airborne sensors.
-
Bit Depth
- The range of values that a particular raster format can store, based on the formula 2n. An 8-bit depth dataset can store 256 unique values.
-
Cloud Cover
- The fraction of an image that is obscured by clouds.
-
Digital Elevation Model (DEM)
- A digital model or 3D representation of a terrain’s surface.
-
Digital Number (DN)
- The original value assigned to a pixel in an image. The DN value will always be within the range determined by the image bit-depth. Thus, an 8-bit depth image will have DNs withing the range of 0-255.
-
False Color
- A group of color rendering methods used to display images in color which were recorded in the visible or non-visible parts of the electromagnetic spectrum to enhance various ground features.
-
Ground Sampling Distance (GSD)
- The distance between two consecutive pixel centers measured on the ground. The bigger the value of the image GSD, the lower the spatial resolution of the image and the less visible details.
-
Histogram Stretch
- A simple image enhancement technique that attempts to improve the contrast in an image by `stretching’ the range of intensity values it contains to span a desired range of values, e.g. the full range of pixel values that the image type concerned allows. Often referred to as contrast stretching or normalization.
-
Monoscopic
- Imagery that is obtained using only one viewpoint or sensor.
-
Multispectral
- Imagery that captures data at specific frequencies across the electromagnetic spectrum, producing several spectral bands.
-
Nadir (Off-Nadir)
- The direction pointing directly below a particular location or sensor, indicating the angle at which an image was obtained.
-
Near Infrared Bands (NIR)
- Bands collected from frequencies along the electromagnetic spectrum closest to visible light. Useful in biological observations and analyses.
-
Orbit
- The curved path of a celestial object or spacecraft around a star, planet, or moon.
-
Orthorectification
- The process of removing the effects of image perspective (tilt) and relief (terrain) effects for the purpose of creating a planimetrically correct image.
-
Panchromatic
- An image with a single band, generally displayed as shades of gray.
-
Pixel
- The smallest unit of information (short for “picture element”) in an image or raster map, usually represented as a cell in an array of data values.
-
Raster
- A type of digital image composed of individual pixels of various data values or colors.
-
Reflectance
- The proportion of incident radiant energy that is reflected by a surface. Reflectance varies according to the wavelengths of the incident radiant energy and the color and composition of the surface.
-
Remote Sensing
- The acquisition of information about a location on earth from satellite or aerial vehicles, in contrast to on-site observation.
-
Spatial Resolution
- A term that refers to the size of the smallest possible feature that can be detected of an image.
-
Spectral Band
- Image data at a specific frequency across the electromagnetic spectrum, including both visible and non-visible light.
-
Stereoscopic
- A process by which two photographs of the same object taken at slightly different angles are viewed together, creating an impression of depth.
-
Swath
- The area imaged on the surface of the earth as a sensor passes over.
-
Temporal Resolution
- A term that refers to precision and measurement with respect to time and commonly describes how often an orbiting sensor can return to the same location on the earth.
-
Thermal Bands
- Image data usually collected from the thermal infrared region of the electromagnetic spectrum and measures the radiance emitted by the surface of the target. This is in contrast to measuring the reflectance of target features in optical imaging.
-
True Color (RGB)
- An image that offers a natural color rendition, appearing to a human observer the same way as if this observer were to directly view the object.
-
Sensor
- An object whose purpose is to detect events or changes in its environment. In remote sensing. In remote sensing, the term usually refers to the instrument collecting imagery from either airborne or spaceborn vehicles.
Summary
In this Guide, we’ve covered:
- Sensor advancement since the 1970s
- The electromagnetic spectrum and remote sensing bands
- Real-world examples of remote sensing
- Terminology and definitions related to satellite imagery