
In this guide
PGC DEM Products – ArcticDEM, REMA, and EarthDEM
Last Updated: December 14, 2023

PGC’s DEM products are collaborative projects to produce 2-meter resolution Digital Elevation Model across the Arctic, Antarctic, and mid-latitudes.
Table of Contents
Background
Scope
License and Usage
Strengths and Weaknesses
Versions
Methodology
Data Description Details
Metadata
Search, Discovery and Download
Common Questions
Disclaimer
Citations
Contributors
Contact
Background
A brief description of our DEM products framework:
The Polar Geospatial Center’s ArcticDEM, REMA, and EarthDEM elevation products are the result of an institutional collaboration between the U.S. National Geospatial-Intelligence Agency (NGA) and the National Science Foundation (NSF). The objective of these efforts are to automatically produce high-resolution, high-quality digital surface models (DSM) of polar regions using optical imagery, high-performance computing, and open source photogrammetry software. The result is a collection of time-dependent DSM strips and seamless terrain mosaics. The polar projects, ArcticDEM and REMA, and select nonpolar regions can be used and distributed without restriction, with exception to Alaska data 2022-present. See EOCL FAQ for more information.
The Polar Geospatial Center and collaborating institutions developed a novel approach to produce high-resolution elevation data at a worldwide scale. Just the polar datasets total over 20 trillion 2-by-2 meter elevation cells covering an area of 20 million square kilometers.
-
- Leverage Maxar’s historical archive of WorldView-1, WorldView-2, and WorldView-3 optical satellite imagery acquired through the NGA’s EnhancedView and EOCL contracts over high latitudes.
- Derive 2-meter resolution elevation models through photogrammetry methods using the Ohio State University’s Surface Extraction with TIN-based Search-space Minimization (SETSM) software package.
- Establish the data production pipeline on NSF-supported high-performance compute resources, including partnership with the National Center for Supercomputing Applications and the Texas Advanced Computing Center.
PGC’s elevation products offer a different way of producing and providing terrain data. These projects are a response to the need for high-quality data, especially in remote locations, to observe and measure topographic change through time. The final products are not a single highly edited and polished product, but rather a collection of time-dependent elevation models and the infrastructure to continually process the flow of imagery from the ever- expanding constellation of earth-observing satellites.
Scope
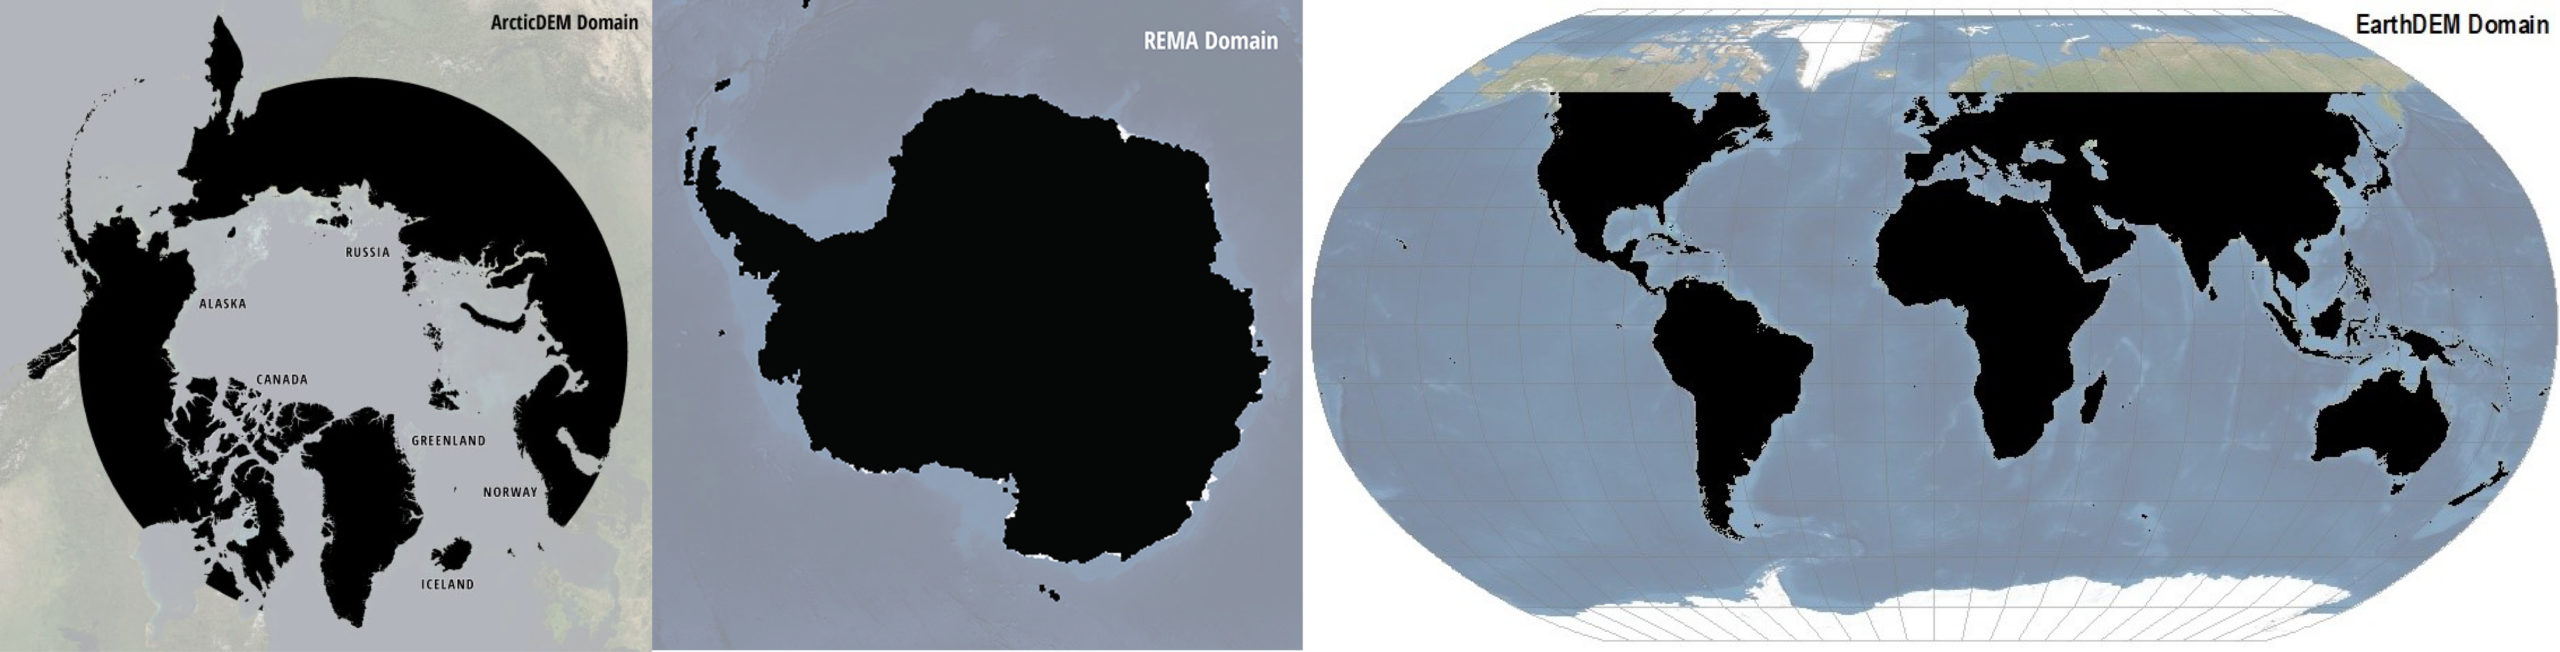
DEM product geographic domains:
ArcticDEM: ArcticDEM data encompasses all land areas north of 60° north latitude, including the entirety of Greenland, Alaska (2007-2021), and the Kamchatka Peninsula of the Russian Federation.
REMA: The Reference Elevation Model of Antarctica encompasses 98% of the Antarctic continental landmass extending to roughly 88°S and includes the subantarctic islands near South America.
EarthDEM: EarthDEM covers all the areas in between the two polar projects, all land areas between approximately 60°N and 60°S.
License and Usage
Important information regarding proper DEM use:
ArcticDEM and REMA data are published under the Creative Commons Attribution 4.0 International Public License (CC-BY-4.0) and may be used, distributed, and modified without permission. Alaska data 2022-present is not publicly available due to EOCL restrictions (see EOCL FAQ for details).
Select EarthDEM regions are also publicly available, though the majority of EarthDEM products are restricted to US Government employees and contractors, federal agency-funded researchers, and partner organizations (see the EarthDEM page for details).
Strengths and Weaknesses
The methodology and scale of this data production initiative has a number of inherent strengths and weaknesses:
Strengths
-
-
-
- The use of three polar orbiting satellites allows ArcticDEM and REMA to cover a large area in polar regions. Satellites frequently revisit high-latitude areas and data generally can be collected quickly.
- Areas can be recollected. This allows for holes/gaps to be filled and also enables the potential for change detection.
- Automation and high performance computing can generate a large amount of terrain in a short period of time. Our HPC partner systems can produce a 2 meter resolution DSM equivalent to the area of Argentina in 24 hours.
- Aircraft are not required. High-latitude and remote areas are actually easier to collect than lower latitude areas near population centers.
-
-
Weaknesses
-
-
-
- There is no “bare earth” product. The source imagery cannot penetrate vegetation or man-made surface features. Such features will exist in the elevation values of the product.
- This is not an “eyes on” or manually edited product. The volume of data is such that manually editing to remove artifacts or improve data would be time and cost prohibitive. Pits, spikes, false landforms, and other DEM anomalies may exist in this dataset. Polygonal hydrographic features have not been flattened and the data has not been hydrologically enforced.
- It is optically derived. Clouds, fog, shadows, and other atmospheric obstructions can obscure the ground and make it impossible to extract terrain.
- DEM strip files have not been edge-matched. Visible seams and deviations between adjacent DEMs may be observed.
- Data volume can be a problem. A single 17 km by 120 km strip of 2 meter resolution terrain data can be over six gigabytes.
- Without ground control points, absolute accuracy is approximately 4 meters in horizontal and vertical planes. Uniform ground control must be applied to achieve higher accuracy. But, DEMs can be co-registered to local ground control points or other reference elevation data to reduce this error to below 50cm.
- The imagery spans multiple years and seasons. A single season/year mosaic is not possible for large areas.
-
-
Digital Surface Model
ArcticDEM, REMA, and EarthDEM products are a Digital Surface Model (DSM) that portrays first-return elevation values that include vegetation, tree canopy, buildings, and other man-made surface features. Exercise caution when using ArcticDEM data for applications that are better served using a bare-earth Digital Terrain Model (DTM) because results may be inaccurate or otherwise misleading.
Interpolation and Filtering
All DEM products derived from SETSM software come from a TIN-based model and pixels are given data values as the TIN is written to a raster. Only edge artifacts are filtered out of the strip DEM data. Errors due to clouds or water may be identified by an additional bitmask file. Mosaic compilation uses a water mask to remove large water bodies. More information on using strip DEM bitmasks and mosaic DEM the water mask datasets can be found in the methodology section.
Limitations
As with any optical imagery-derived elevation product, void areas or artifacts may appear where cloud cover, shadows, and unfrozen water bodies exist in the source imagery, or in regions of low radiometric contrast where pixel correlation cannot be resolved by the software.
Considerations
ArcticDEM, REMA, and EarthDEM have been assembled from source imagery collected over a period of several years and includes data collected throughout all seasons. Users should not assume that DEM data represent snow-free, leaf-off, or other temporally variable conditions. Every effort has been made to introduce the best-available source images into the final product, notwithstanding the challenges of producing a pan-Arctic dataset where source material from a single season or year is unavailable.
Versions
A chronicle of DEM data releases and specifications:
Current DEM strips supercede all previous versions. All previously released DEM strip data including ArcticDEM v3, REMA v1, and EarthDEM v1 is discontinued.
| DEM STRIPS | |||
| Version | Date released | Notes | Methodology |
| s2s041 | Oct 2023 | Annual release for ArcticDEM and REMA for calendar year 2022 | Data mask included, not applied; improved scene merging |
| s2s041 | Oct 2022 | Supercedes all REMA v1, EarthDEM v1, and ArcticDEM v3 strips | Data mask included, not applied; improved scene merging |
| s2s040 | Oct 2021 | Equivalent to EarthDEM v1 strips | Data mask included, not applied |
| s2s030 | Sept 2018 | Equivalent to REMA v1 and ArcticDEM v3 strips | Bad data mask applied |
| DEM MOSAICS | |||
| Version | Date released | Notes | Methodology |
| ArcticDEM v4.1 | July 2023 | Median-style | |
| ArcticDEM v3 | Sept 2018 | Manual selection | |
| ArcticDEM v2 | Manual selection | ||
| ArcticDEM v1 | Manual selection | ||
|
|
|||
| REMA v2 | Oct 2022 | Median-style | |
| REMA v1.1 | Oct 2018 | Manual selection | |
| REMA v1 | Sept 2018 | Manual selection | |
|
|
|||
| EarthDEM v1.1 | Coming Soon | Median-style | |
| EarthDEM v1 | Oct 2021 | Limited geographic distribution | Median-style |
Methodology
Source Material
ArcticDEM, REMA, and EarthDEM data are constructed from in-track and cross-track high-resolution (~0.5 meter) imagery acquired by Maxar’s constellation of optical imaging satellites, licensed through the NGA NextView contract. Most DEM data are generated from the panchromatic bands of the WorldView-1, WorldView-2, and WorldView-3 satellites. A small percentage of data was generated from the GeoEye-1 satellite sensor.
PGC elevation products are generated by applying stereo auto-correlation techniques to overlapping pairs of high-resolution optical satellite images (“stereo pairs”). The SETSM photogrammetry software developed by M.J. Noh and Ian Howat at the Ohio State University is used to extract elevation data from stereo pair images, creating digital elevation models (DEMs). DEM extraction is a compute-intensive process that has utilized millions of node hours on the Blue Waters supercomputer at the National Center for Supercomputing Applications at the University of Illinois at Urbana-Champaign and the Frontera supercomputer at the Texas Advanced Computing Center.
For additional information on SETSM software (GitHub repo), see:
Noh, M.J., I.M. Howat, Automated stereo-photogrammetric DEM generation at high latitudes: Surface Extraction from TIN-Based Search Minimization (SETSM) validation and demonstration over glaciated regions, GIScience and Remote Sensing, doi:10.1080/15481603.2015.1008621
Output DEM raster files are available as 1) “strip” files output directly from SETSM that preserve the original source material’s temporal resolution and 2) mosaic files compiled from multiple strips that have been synthesized to make seamless elevation models.
DEM Strips
Strip DEM files correspond to the overlap area of the input stereopair image swaths as they are collected by Maxar’s polar-orbiting satellites. Strip DEM dimensions vary according to the satellite sensor that acquired the images and the off-nadir angle of collection. Most strips are between 16 km and 18 km in width, and 110 km and 120 km in length.
The DEM production workflow has SETSM process the stereopair in smaller “scene DEM” chunks, which are then coregistered and merged to create the final strip DEM product using a Python program called scenes2strips (GitHub repo). Where the scene DEMs are unable to be coregistered, the output strip DEM is broken into multiple segments. The strip DEM segment is the unit by which this data is packaged and released.
“Bad Data” Masking
In the process of coregistering and merging the scene DEMs into strip DEMs, areas of potentially erroneous elevation data in the SETSM output are identified using a set of automated filters. The filters attempt to distinguish three sources of erroneous data in the DEMs:
-
Bad edge data
- Raw SETSM scene DEMs often have a thin strip of erroneous data at the edges of the DEM extent. It is identified by the presence of a characteristic artificially high slope in the elevation values.
-
Bad water data
- SETSM does not produce a consistent surface over open water. Where the water surface in input stereo images is dark and relatively smooth (not choppy as would be over oceans and other large bodies of water) the automated water filter performs well.
-
Bad cloud data
- Varying opacity in cloud cover results in a varying degree of error in SETSM DEM height values. The cloud filter performs well where cloud cover is thick and the extent of the cloud cover has a relatively well-defined edge. It does not perform as well where cloud cover is thin and the extent of the area covered by clouds is ill-defined.
In early releases of ArcticDEM and REMA, the strip DEM data were produced with areas of potentially bad data identified by these three filters automatically masked (i.e. set to NoData) in the output rasters. Strip DEM data were thus provided for download in this “fully-masked” state. Driven by community interest and acknowledgement that the filters sometimes remove valuable good elevation data, the strip DEM production routine was adjusted to allow for creation of a strip DEM product where the output rasters are not automatically masked with the water and cloud filters. The edge mask is always applied during assembly of the strip DEMs in order to create a seamless elevation surface through coregistration and merging of the scene DEMs.
From version s2s040 onwards, the strip DEM data are provided for download in an “unmasked” state where areas of potentially bad data identified by the water and cloud filters are not masked in the strip DEM rasters. Instead, a new *_bitmask.tif raster is included with every strip DEM segment that contains the three (edge, water, cloud) component masks resulting from application of the automatic filters described above. A visual interpretation of the bitmask raster can be found on page 3 of the PGC User Strip DEM Documentation, and a complete technical specification can be found in the Bitmask Format section below. This bitmask raster is provided so that end users can inspect these data quality masks and optionally use them to mask out the bad data with the aid of software such as the Raster Calculator tool commonly found in GIS applications. PGC provides a Python routine that can selectively apply one or more of the bitmask component masks to mask out data in the strip DEM rasters.
Masking Instructions
PGC’s official Python script to apply the bitmask to strip DEM data can be found on GitHub in the latest SETSM bitmask batch_mask.py release. This script has the capability to selectively apply any combination of the three bitmask layers to any combination of the strip DEM component rasters (*_dem.tif, *_matchtag.tif, *_ortho.tif, etc.). See the repo’s ‘batch-mask-only’ branch README for instructions on building the required Python environment and running the script.
Bitmask Format
The strip DEM *_bitmask.tif file is a UInt8 bitmask raster in which the three least significant bits (LSB) X-X-X (rightmost being the least significant bit) correspond to the presence of Cloud-Water-Edge components of the mask, respectively. When interpreting the pixel values in base 10, this means 0=good data, 1=edge, 2=water, 4=cloud, with integers in-between and up to 7 (1-1-1 in binary) meaning that pixel is covered by a combination of the three components. A lookup table is provided below.
Using this mask, the water and/or cloud filters as they are computed for each scene/strip during the filtering step of the scenes2strips program can optionally be applied to any (unfiltered) strip (or scene) DEMs after they have been created, using the batch_mask.py script. The edge component of the mask is always applied in both the coregistration and mosaicking steps of the scenes2strips program because currently bad data is always present on the edges of the scene DEMs when they come out of SETSM.
| Bit Index (zero-based, from LSB) | 3-7 | 2 | 1 | 0 | ||
| Bit Indication | Not used | Cloud | Water | Edge | ||
| Bit Value | Bit Value | Bit Value | Bit Value | Decimal Value | Interpretation | |
| 00000 | 0 | 0 | 0 | 0 | “Good data” | |
| 00000 | 0 | 0 | 1 | 1 | Bad edge data | |
| 00000 | 0 | 1 | 0 | 2 | Water | |
| 00000 | 0 | 1 | 1 | 3 | Water and edge | |
| 00000 | 1 | 0 | 0 | 4 | Cloud | |
| 00000 | 1 | 0 | 1 | 5 | Cloud and edge | |
| 00000 | 1 | 1 | 0 | 6 | Cloud and water | |
| 00000 | 1 | 1 | 1 | 7 | Cloud, water, and edge |
Registration
In version s2s030, all strip DEM segments were registered to ICESat-1 altimetry data. Residual statistics and a resulting translation vector for the end user to optionally apply was included in the strip DEM metadata. Later analyses of translation vector application to the strip DEM dataset found the quality of the registration to be too inconsistent to make for useful applications. It is for this reason that later strip DEM versions have not been registered to ICESat-1 data. Future registration of strip DEM data to ICESat-2 is planned, and the translation vector information will be published separately from the strip DEM metadata.
Version Notes
s2s030
- This version of strip DEM data was created for only the ArcticDEM and REMA projects.
- ArcticDEM strip data is created from regular SETSM output, while REMA strip data is created from SETSM output run through SETSM’s Local Surface Fitting module to reduce noise in the DEMs.
- Automatic data quality filters are applied to mask out areas in the DEM data where potentially erroneous elevation data came from the SETSM output.
- Automatic registration of strip DEM elevation values to ICESat-1 altimetry data is included in strip DEM metadata, intended for optional application by end users.
s2s04X
- All strip DEM data is created from SETSM output run through SETSM’s Local Surface Fitting module.
- Automatic data quality filters are not applied to the strip DEM data. Instead, a new bitmask raster is included for optional mask application by the end user.
s2s040
- This version of strip DEM data was created for all three ArcticDEM, REMA, and EarthDEM projects. It is also the first version of strip DEM data created for the EarthDEM project.
- Strip DEM coverage includes all stereopairs present in previous versions and adds new stereopairs.
- Registration of strip DEM elevation values to other altimetry data is not calculated.
s2s041
- This version of strip DEM data was created for all three ArcticDEM, REMA, and EarthDEM projects.
- Strip DEM coverage includes all stereopairs present in previous versions and adds new stereopairs.
- All strip DEM data is reprocessed with a relaxed scene DEM coregistration error tolerance in order to reduce the number of small strip DEM segments in the dataset and to produce longer, more complete strip DEMs.
- Registration of strip DEM elevation values to other altimetry data has not yet been calculated, but a re-release of data from this version with registration included in strip DEM metadata is planned.
Accuracy
The accuracy of SETSM DEMs was evaluated in Noh, M.J., I.M. Howat, Automated stereo-photogrammetric DEM generation at high latitudes: Surface Extraction from TIN-Based Search Minimization (SETSM) validation and demonstration over glaciated regions, GIScience and Remote Sensing, doi:10.1080/15481603.2015.1008621. Absolute horizontal and vertical accuracy specifications of ArcticDEM, REMA, and EarthDEM strip DEMs have not been verified. Future work may include further validation.
DEM Mosaics
DEM mosaic tiles are formed into 100km x 100 km tiles in the local projection using the entire stack of strip DEMs as source data. As a result the mosaics include DEMs from all seasons where the sun elevation is sufficiently high to acquire satellite imagery.
Median-style mosaic method – Since 2020, PGC has used a median-style mosaicking method, which provides the median value of elevations from repeat strip DEMs at each pixel, with filtering applied to remove outliers. The number of repeat DEMs, the median absolute deviation, and the time range of DEM acquisitions at each mosaic pixel are provided as auxiliary files to identify potential areas of poor quality data and highlight rapidly changing features. The full tiles are subset to 50 x 50 km for distribution and feathered along their edges to remove any abrupt discontinuities.
This method requires a water mask to mark areas with a high likelihood of poor data quality across all the component Strip DEMs. For REMA version 2, the most recent Antarctic coastline in the Antarctic Digital Database was used. For ArcticDEM version 4.1 and EarthDEM version 1, the Global Surface Water dataset was used.
Post-processing – REMA version 2 used ICESat-2 and Tandem-X 90m PolarDEM to align the mosaic tiles, assess accuracy, and correct minor artifacts. The most recent Antarctic coastline in the Antarctic Digital Database was used to mask out poor-quailty data over the ocean and add the sea surface height to the dataset. In areas of rapid change, annual time-slice mosaics were produced and the most recent year with complete coverage and a consistent surface was patched into the all-years median mosaic results. Certain continental-scale reduced-resolution REMA mosaics included a version where the “pole hole” south of 88 degrees south was filled with the Copernicus DEM GLO-30 product.
Post-processing – ArcticDEM version 4.1 tiles over Greenland used the same approach from REMA version 2 to mask out poor data over the ocean and add the sea surface height to the dataset. To improve surface height alignment on the borders between tiles, the 2m tile data was registered to a 10m version of the Greenland Ice Mapping Project (GrIMP) version 2 DEM. For tiles outside of Greenland, the ESA WorldCover 2020 dataset “Permanent water bodies” class was used to fill all corresponding areas in the mosaic over lakes, rivers, and ocean with the Copernicus DEM GLO-30 product. The purpose of this fill was to apply a hydro-flattening to water surfaces that would otherwise often contain erroneous elevation data in the raw output from the SETSM DEM mosaic.
Contiguous pieces of land in each tile were vertically registered to the Copernicus DEM GLO-30 product. As with REMA v2, special attention was given to fast-moving glaciers in Greenland and a select few locations across the Arctic, where annual time-slice mosaics were produced and the most recent year with complete coverage and a consistent surface was patched into the all-years median mosaic results. As part of an eyes-on quality control assessment, tiles that had large blunders in the elevation data were run through an automatic blunder-detection filter. The filter identified and masked out as NoData areas in the DEM with an average slope value that differed considerably from the corresponding area in the Copernicus DEM GLO-30 product.
Post-processing – EarthDEM version 1 had no post-processing applied. As a result, the dataset includes more erroneous data due to open water and cloud cover. The EarthDEM domain also has far fewer repeat collections because of the satellites’ orbital geometry, among other factors. Without a deep “stack” of observations over a given area, the median-style mosaicking method is less likely to be able to filter out bad pixel values as outliers.
Manual selection mosaic method (DEPRECATED) – Participants at PGC and OSU used a DEM selection tool to rate candidate strip DEMs. This QC rating was then included in the mosaicking process to ensure the mosaic reflected the best quality DEMs. All component strips were coregistered to the reference strip DEM and feathered along their edges to remove abrupt discontinuities. Each final 100 km x 100 km tile was then registered to reference elevation (ArcticDEM: ICEsat-1, REMA: ICESat and CryoSat) and feathered with its neighbors. 2m mosaics were further divided into 50 km x 50 km subtiles for release. ArcticDEM version 1-3 and REMA versions 1 and 1.1 used this method.
Accuracy
ArcticDEM, REMA, and EarthDEM mosaic DEMs each use different reference datasets to improve tile alignment and fill NoData gaps caused by water bodies. These datasets are detailed in the post-processing description for each project. Region-specific post-processing introduces additional variables that can influence product accuracy. Absolute horizontal and vertical accuracy specifications have not been verified. Future work may include validation.
Data Description Details
Format
DEM data are stored and distributed in Cloud Optimized GeoTIFF raster file format with 32-bit floating point elevation values and LZW compression. Height values are truncated at 1/128th of a meter (~1 cm) to reduce file sizes.
Resolution
DEM strip and mosaic files are distributed at a ground sample distance (GSD) of 2 meters. Mosaic files are also available at reduced resolutions of 10 meters, 32 meters, 100 meters, 500 meters, and 1 kilometer for cartographic purposes.
Coordinate System
ArcticDEM products are projected to National Snow and Ice Data Center (NSIDC) Sea Ice Polar Stereographic North projection and referenced to WGS84 horizontal datum (EPSG:3413).
REMA products are projected to Antarctic Polar Stereographic projection and referenced to the WGS84 horizontal datum (EPSG:3031).
EarthDEM products are projected to the nearest UTM zone (north or south) projection and referenced to the WGS84 horizontal datum (EPSG:32601 to EPSG:32760).
Vertical Reference
Vertical reference is height above the WGS84 ellipsoid. These values can differ significantly from Geoidal and Mean Sea Level heights.
Elevation Units
Elevation unit of measure is meters.
Null Values
Data may contain void pixels or regions over lakes, rivers, and other hydrographic features. Data voids may also be present where the source imagery contains cloud cover or shadowed areas. The void areas will contain null values (-9999) in lieu of the terrain elevations.
Metadata
Basic source material and production metadata is contained within the extent geospatial files and associated text files provided for each DEM strip and mosaic file. Detail descriptions can be found in the Metadata section of this guide.
Metadata
Strip DEM Products
Naming Convention
File naming of strip DEM products incorporate several elements related to the source imagery used to create the data. Previous Strip DEM versions used a slightly modified naming scheme. This refers to versions greater than s2s041. The example below describes the naming convention:
Key: ALGORTHM_VERSION_SENSOR_DATE_IMAGE1_IMAGE2_SEGMENT_RESOLUTION_FILETYPE
Example: SETSM_s2s041_WV02_20150615_10300100443C2D00_1030010043373000_seg1_2m_dem
| ALGORITHM | Algorithm used to extract elevation (i.e. SETSM). |
| VERSION | Release version of DEM strip. |
| SENSOR | Maxar satellite(s) that collected the stereopair images. Intrack pairs denoted by single sensor abbreviation (e.g. WV01). Crosstrack pairs denoted by a double sensor abbreviation (e.g. W1W2). |
| DATE | Date of earliest source stereopair image acquisition as YYYYMMDD. |
| IMAGE1 | Maxar Catalog ID number of the first stereopair image strip. |
| IMAGE2 | Maxar Catalog ID number of the second stereopair image strip. |
| SEGMENT | Segment of the DEM strip. |
| RESOLUTION | Ground sample distance (GSD) pixel size of the DEM in meters. |
| FILETYPE | Category of file. |
Files Included
| index/*.shp | Esri shapefile for the strip extent, including brief metadata attributes (present in TAR-packaged distribution only). |
| *_dem.tif | 32-bit floating point elevation raster. This is the primary DEM strip data file. |
| *_dem_10m_shade.tif | 8-bit, reduced resolution (10 m) hillshade representation of the strip. |
| *_matchtag.tif | Raster indicating DEM pixels derived from a stereo match (1) or those that have been interpolated (0). |
| *_bitmask.tif | 3-bit raster containing data quality masks identifying potentially erroneous elevation data. |
| *_mdf.txt | Text file metadata document. |
| *_readme.txt | Metadata text file describing file contents of the .tar archive and data disclaimer / agreements. |
Organizational Structure
Strip DEM files are distributed in folders according to the 1° x 1° geocell in which the geometric center resides. Geocell folder naming refers to the southwest degree corner coordinate (e.g., folder n72e129 will contain all ArcticDEM strip files with centroids within 72° to 73° north latitude, and 129° to 130° east longitude).
Metadata Fields
| Field Name | Short Name | Description |
| dem_id | dem_id | Identifier for the produced DEM strip segment. |
| pairname | pairname | Identifier for the stereopair. |
| stripdemid | stripdemid | Identifier for the stereopair built with indicated SETSM version and resolution. |
| sensor1 | sensor1 | Maxar sensor that collected Image 1 of the stereopair. |
| sensor2 | sensor2 | Maxar sensor that collected Image 2 of the stereopair. |
| catalogid1 | catalogid1 | Maxar Catalog ID identifier for Image 1 of the stereopair. |
| catalogid2 | catalogid2 | Maxar Catalog ID identifier for Image 2 of the stereopair. |
| acqdate1 | acqdate1 | Acquisition date for Image 1 of the stereopair. |
| acqdate2 | acqdate2 | Acquisition date for Image 2 of the stereopair. |
| gsd | gsd | Ground sample distance of the DEM in meters. |
| epsg | epsg | EPSG code identifier for the DEM spatial reference system. |
| setsm_ver | setsm_ver | SETSM version used to build the stereopair scene DEMs. |
| s2s_ver | s2s_ver | scenes2strips version used to process the strip DEM. |
| creationdate | cr_date | Date of scenes2strips processing for the strip DEM. |
| geocell | geocell | 1 degree latitude by 1 degree longitude cell that contains the strip DEM centroid. |
| is_lsf | is_lsf | Binary 1/0 (yes/no) indicating whether the strip DEM was built from SETSM results run through SETSM’s Local Surface Fitting module. |
| is_xtrack | is_xtrack | Binary 1/0 (yes/no) indicating whether the stereopair is cross-track imagery (otherwise it is in-track imagery). |
| **valid_area_matchtag_density | validdens | Ratio of data pixels in the DEM marked as match points from SETSM, considering only *valid data pixels. |
| valid_area_sqkm | validarea1 | Area covered by all *valid data pixels. |
| **valid_area_percent | validarea2 | Percent of all data pixels in the DEM considered *valid data. |
| water_area_sqkm | waterarea1 | Area in square kilometers covered by all data pixels identified as potentially water in the bitmask. |
| water_area_percent | waterarea2 | Percent of all data pixels in the DEM identified as potentially water in the bitmask. |
| cloud_area_sqkm | cloudarea1 | Area in square kilometers covered by all data pixels identified as potentially cloud cover in the bitmask. |
| cloud_area_percent | cloudarea2 | Percent of all data pixels in the DEM identified as potentially cloud cover in the bitmask. |
| avg_convergence_angle | avg_conver | The average convergence angle of all stereo image pairs processed by SETSM and merged to create the DEM strip segment. |
| avg_expected_height_accuracy | avg_expect | The average height accuracy in meters of all stereo image pairs processed by SETSM and merged to create the DEM strip segment. |
| avg_sun_elev1 | avg_sunel1 | The average sun elevation in degrees of all images from Image 1 of the stereopair processed by SETSM and merged to create the DEM strip segment. |
| avg_sun_elev2 | avg_sunel2 | The average sun elevation in degrees of all images from Image 2 of the stereopair processed by SETSM and merged to create the DEM strip segment. |
| rmse | rmse | Average RMSE in meters from coregistration of all DEM scenes that were merged to create the DEM strip segment. |
| fileurl | fileurl | URL to HTTP download of tarball containing all files for the DEM strip segment. |
| s3url | s3url | URL to AWS S3 STAC index record for the DEM strip segment. |
*Only in the context of strip DEM metadata fields, “valid” means pixels that are not identified as potentially erroneous data in the strip bitmask raster.
**When filtering the strip DEM dataset for the highest quality DEM data, it is recommended to use the valid_area_matchtag_density and valid_area_percent fields as follows:
-
- Over land, filter for high valid_area_matchtag_density and high valid_area_percent. The exact values of filter thresholds will depend on the collection of strip DEMs in your geographic area of interest.
- Over land-water boundaries, filter for only high valid_area_matchtag_density. Strip DEMs that happen to include more water than others will have a lower valid_area_percent, and filtering by that field can yield inconsistent results.
Mosaic DEM Products
Tiling Schemes
PGC’s DEM mosaic tiles require a planar projection instead of a projection based on latitude/longitude because of their high resolution. The mosaic tiling scheme is described for each project:
ArcticDEM
A single mosaic tiling scheme was built in an arctic polar stereographic projection (EPSG:3413). The tiling grid begins at 01_01 at x=-4,000,000, y=-4,000,000 and ends with 81_80 at x=4,000,000, y=4,100,000. Tiles over ocean and those outside the ArcticDEM domain are not included.
REMA
A single mosaic tiling scheme was built in an antarctic polar stereographic projection (EPSG:3031). The tiling grid begins at 01_01 at x=-4,000,000, y=-4,000,000 and ends with 80_80 at x=4,000,000, y=4,000,000. Tiles over ocea and those outside the REMA domain are not included.
EarthDEM
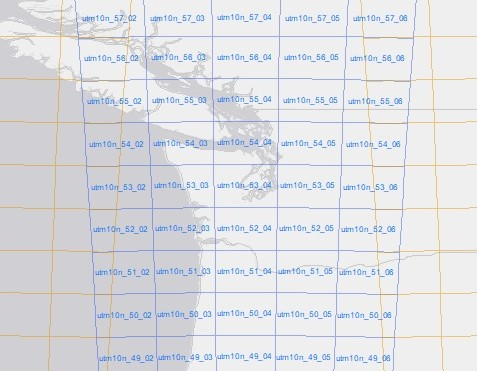
Mosaic tiling schemes were built for every UTM zone on a 100 km x 100 km grid. For the UTM South zones, the tiling grid begins with 01_01 at x=150,000, y=3,300,000 (-60.4°S) and ends with 67_07 at x=850,000, y=10,000,000 (equator) . UTM North tile grids begin with 01_01 at x=150,000, y=0 (equator) and end with 67_07 at x=850,000, y=6,700,000 (~60.4°N). Redundant tiles are removed where tiles from adjacent mosaic schemes overlap fully. Tiles over ocean are similarly not included.
Subtiling
To limit the file sizes, each 100 km x 100 km mosaic is divided into 50 km x 50 km subtiles named according to the row/column position illustrated in this example:
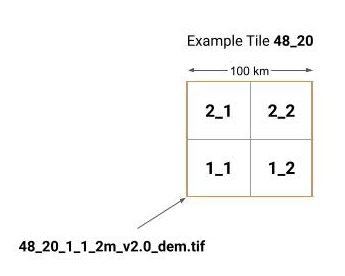
Naming Convention
Key: MOSAIC_TILE_SUBTILE_RESOLUTION_VERSION_FILETYPE
Example: utm10n_09_40_1_2_2m_v1.0_dem
| MOSAIC | Mosaic scheme denoted by utm zone (EarthDEM only) |
| TILE | Tile index row and column |
| SUBTILE | Sub-tile index row and column if tiles are subdivided |
| RESOLUTION | Ground sample distance (GSD) pixel size of the DEM in meters |
| VERSION | Mosaic version |
| FILETYPE | Category of file |
Files Included
| index/*.shp | Esri shapefile for the tile boundary, including metadata attributes (present in TAR-packaged distribution only) |
| *_browse.tif | 10m DEM hillshade |
| *_datamask.tif | Raster indicating DEM pixels with heights purely sourced from SETSM output (1) versus those that have been filled/merged with another dataset or mask out as NoData in quality control steps (0). |
| *_dem.tif | 32-bit floating point elevation raster. This is the primary DEM tile datafile. |
| *_count.tif | Number of contributing DEMs |
| *_countmt.tif | Number of contributing DEMs excluding interpolated pixels – DO NOT USE (if present). The values in this file are unreliable in EarthDEM v1.0 and REMA v2.0. Instead, we suggest using *_count.tif and/or *_mad.tif to assess the confidence of a pixel. |
| *_mad.tif | Median absolute deviation of contributing DEMs |
| *_maxdate.tif | Latest date of contributing DEMs in days since Jan 1, 2000 |
| *_mindate.tif | Earliest date of contributing DEMs in days since Jan 1, 2000 |
| *_meta.txt | Metadata text file describing source imagery, creation date, registration sources and statistics. |
Organizational Structure
DEM mosaic files are organized into groups based on the 100km x 100km tile ID. Each folder contains up to four sub-tiled 50 km x 50 km DEM mosaics.
Metadata Fields
| Field Name | Short Name | Description |
| dem_id | dem_id | Identifier for the produced DEM tile. |
| tile | tile | ID of the tile in the project tile grid for the produced DEM tile. |
| supertile | supertile | ID of the 100km x 100km tile in the project tile grid for the produced DEM tile. |
| gsd | gsd | Ground sample distance of the DEM in meters. |
| epsg | epsg | EPSG code identifier for the DEM spatial reference system. |
| release_ver | rel_ver | Release version number of the mosaic dataset. |
| creationdate | cr_date | Creation date of the DEM tile. |
| data_percent | data_perc | Percent of pixels in the DEM tile marked as match points from SETSM processing. |
| num_components | num_comp | Count of unique stereopairs from DEM strips merged to create the DEM tile. |
| fileurl | fileurl | URL to HTTP download of tarball containing all files for the DEM tile. |
| s3url | s3url | URL to AWS S3 STAC index record for the DEM tile. |
Search, Discovery and Download
Publicly Available Datasets
The Polar Geospatial Center makes ArcticDEM and REMA data (and select EarthDEM data) available for discovery and download as tar archives on our servers. The data are also available in a STAC catalog and housed in a public AWS bucket.
Download from PGC
STRIP DEMS AVAILABLE AT 2-METER RESOLUTION:
-
-
- ArcticDEM Strip DEM extent index – with data download links (SHP | GDB | GPKG | PARQUET)
- ArcticDEM Strip DEM data download via HTTP (browser): https://data.pgc.umn.edu/elev/dem/setsm/ArcticDEM/strips/latest/2m
- REMA Strip DEM extent index – with data download links (SHP | GDB | GPKG | PARQUET)
- REMA Strip DEM data download via HTTP (browser): https://data.pgc.umn.edu/elev/dem/setsm/REMA/strips/latest/2m
-
MOSAIC DEMS AVAILABLE AT 2-METER RESOLUTION:
-
-
- ArcticDEM Mosaic DEM extent indexes – with data download links (SHP | GDB | GPKG | PARQUET)
- ArcticDEM Mosaic DEM data download via HTTP (browser): https://data.pgc.umn.edu/elev/dem/setsm/ArcticDEM/mosaic/latest
- REMA Mosaic DEM extent indexes – with data download links (SHP | GDB | GPKG | PARQUET)
- REMA Mosaic DEM data download via HTTP (browser): https://data.pgc.umn.edu/elev/dem/setsm/REMA/mosaic/latest
-
Bulk Download
Users familiar with the GNU Wget command-line utility can use the following commands to batch download PGC DEM data. There is a Windows version of wget. If you have made a selection of PGC DEM data using one of the provided spatial index files, you can also take the download URLs from the “fileurl” field and input them into a batch file downloader app such as the free and open-source JDownloader program.
Please note, the first two commands will download the entire dataset, which is over 200 TB for strips and 20 TB for mosaics. Use the subdirectory examples to limit your download.
2-meter strips (entire dataset!)
wget -r -N -nH -np -R index.html* --cut-dirs=3 https://data.pgc.umn.edu/elev/dem/setsm/REMA/strips/s2s041/2m/
wget -r -N -nH -np -R index.html* --cut-dirs=3 https://data.pgc.umn.edu/elev/dem/setsm/ArcticDEM/strips/s2s041/2m/
2-meter mosaic tiles (entire dataset!)
wget -r -N -nH -np -R index.html* --cut-dirs=3 https://data.pgc.umn.edu/elev/dem/setsm/REMA/mosaic/v2.0/2m/
wget -r -N -nH -np -R index.html* --cut-dirs=3 https://data.pgc.umn.edu/elev/dem/setsm/ArcticDEM/mosaic/v4.1/2m/
2-meter strips (subdirectory example)
wget -r -N -nH -np -R index.html* --cut-dirs=3 https://data.pgc.umn.edu/elev/dem/setsm/REMA/strips/s2s041/2m/72e155/
wget -r -N -nH -np -R index.html* --cut-dirs=3 https://data.pgc.umn.edu/elev/dem/setsm/ArcticDEM/strips/s2s041/2m/n55e155/
2-meter mosaic tiles (subdirectory example)
wget -r -N -nH -np -R index.html* --cut-dirs=3 https://data.pgc.umn.edu/elev/dem/setsm/REMA/mosaic/v2.0/2m/18_28/
wget -r -N -nH -np -R index.html* --cut-dirs=3 https://data.pgc.umn.edu/elev/dem/setsm/ArcticDEM/mosaic/v4.1/2m/15_27/
Download from AWS
All publicly-available DEM data from our projects are also hosted in an open AWS bucket and indexed with a STAC catalog. DEM data assets can be identified using the DEM STAC items and downloaded or used directly in the cloud.
ArcticDEM AWS Open Data Registry page:
REMA AWS Open Data Registry page:
Download from OpenTopography
OpenTopography is distributing the ArcticDEM (version 4, released August 2023) and REMA datasets with value-added tools for access, processing, and visualization.
32m and 10m resolution data products are open to all users.
2m resolution data products are restricted to education and research users.
Opentopography Arcticdem page:
Opentopography REMA page:
VRTs
Users can directly load the mosaic tiles into certain GIS programs and applications without downloading data by using GDAL’s Virtual Format.
Arcticdem VRT files representing 2, 10, and 32-meter resolution mosaics:
REMA VRT files representing 2, 10, and 32-meter resolution mosaics:
Reference these VRTs in the cloud from your GIS or application or download them locally. Note they can be slow to load initially.
Web Services and Applications
PGC and ESRI developed web services and applications in support of ArcticDEM and REMA data that, in addition to providing raw download capability, can be used to view, explore and perform basic analysis and geoprocessing tasks.
Need help connecting to web service layers? Check out PGC’s guide to using web services in ArcGIS and QGIS to get you started.
Web Applications
ARCTICDEM
-
- PGC Fridge Data Portal: https://fridge.pgc.umn.edu/
- Esri ArcticDEM Explorer: https://arcticdem.apps.pgc.umn.edu/
- NGA ArcticDEM Download Tool: https://experience.arcgis.com/experience/2421b622f54a4a86ae5efb8c4b2c4ef9
REma
-
- PGC Fridge Data Portal: https://fridge.pgc.umn.edu/
- Esri REMA Explorer: https://rema.apps.pgc.umn.edu/
- Esri REMA Hillshade Viewer: https://www.arcgis.com/apps/View/index.html?appid=86a9728459aa4d18b4444b74d330832e
Web Services
ARCTICDEM
-
-
- ArcticDEM 2m strip index
- ArcticDEM 2m tile index
-
- Feature Service: https://services.arcgis.com/8df8p0NlLFEShl0r/arcgis/rest/services/PGC_ArcticDEM_latest_Tile_Index/FeatureServer
- ArcGIS Online Item: https://umn.maps.arcgis.com/home/item.html?id=a5c4c757c32d4c399aadda6ea671079e
-
- ArcticDEM mosaic-only Image Service
-
- https://overlord.pgc.umn.edu/arcgis/rest/services/elevation/pgc_arcticdem_mosaics_latest/ImageServer
-
- ArcticDEM composite (strip and mosaic) Image Service
-
- REST Endpoint: https://di-pgc.img.arcgis.com/arcgis/rest/services/arcticdem_latest/ImageServer
- ArcGIS Online Item: https://umn.maps.arcgis.com/home/item.html?id=4334ffd98a0a4be685f81157a6fbdeca
- WMS Service: https://di-pgc.img.arcgis.com/arcgis/services/arcticdem_latest/ImageServer/WMSServer
- WCS Service: https://di-pgc.img.arcgis.com/arcgis/services/arcticdem_latest/ImageServer/WCSServer
-
-
REMA
-
-
- REMA 2m strip index
- REMA 2m tile index
- REMA mosaic-only Image Service
- REMA composite (strip and mosaic) Image Service
-
Limited Distribution Datasets
Aside from select areas, Alaska ArcticDEM data 2022-present and most EarthDEM data are restricted to US Government employees and contractors, federal agency-funded researchers, and partner organizations due to EOCL restrictions. See our EOCL FAQ for details.
The EarthDEM datasets are hosted by the NASA Commercial Smallsat Data Acquisition Program. You can download the data by applying for an account on their website. PGC publishes index GIS datasets showing the extent of the EarthDEM datasets at NASA
Common Questions
- Why is the data in a Polar Stereographic map projection?
- Polar stereographic map projections were selected by the ArcticDEM and REMA production team because it represents the most suitable metric projection that can be applied to areas north of 60°N latitude and south of 60°S latitude without the need for zones. Reprojections and datum transformations can be performed in nearly all contemporary GIS software programs.
- Does ArcticDEM / REM/ EarthDEM have copyright restrictions?
- There is no license for the ArcticDEM and REMA data and it can be used, distributed, and modified without permission with exception to Alaska data 2022-present due to EOCL restrictions (see the EOCL FAQ for details). Select EarthDEM regions are also publicly available, though the majority of EarthDEM products are restricted to US Government employees and contractors, federal agency-funded researchers, and partner organizations (see the EarthDEM page for details).
- What acknowledgements do I need to include in derived products and products that use PGC DEMs?
- Please refer to our Acknowledgement Policy for specific details.
- Is SETSM software open source and available for download?
- Yes, SETSM is an open source software. For more information, download, and user manual please visit: https://mjremotesensing.wordpress.com/setsm/.
- What is the difference between the DEM strip files and mosaic tiles?
- The DEM strips are extracted from Maxar WorldView-1, WorldView-2 and WorldView-3 imagery and correspond to specific times and dates, being especially valuable for time-sensitive analyses.
The mosaic tiles are most currently compiled using a median-style mosaicking method, which provides the median value of elevations from repeat strip DEMs at each pixel, with filtering applied to remove outliers. The number of repeat DEMs, the median absolute deviation, and the time range of DEM acquisitions at each mosaic pixel are provided as auxiliary files to identify potential areas of poor quality data and highlight rapidly changing features. Mosaics are not intended for temporal research and are most valuable for visualizations and comprehensive coverage. Note that previous versions used a manual mosaic method. Read more in the Methodology section. We recognize this is just one way to assemble a mosaic; we expect that users will assemble mosaics that fit their specialized requirements.
- Are ground control points used to improve the data?
- Version 4.1 Strip DEMs do not include information on suggested coregistration offsets. Previous versions used IceSAT-1 to improve the vertical accuracy of the DEM strips, but the difference in spatial resolution and collection date made the provided offsets unreliable. Future work may include distributing improved registration parameters using IceSAT-2 or other reference datasets.
- Why are there holes/voids in some of the mosaic data?
- The mosaics are built from optical imagery collected from orbit and automated using the median value of elevations from repeat strip DEMs at each pixel. Automated filtering is applied to remove outliers that may be poor data quality due to atmospheric obstructions and environmental conditions such as clouds, fog, shadows, and water, trees, etc. Individual DEM strips with better quality data can be used to fill voids.
- If you are removing bad data then why are there still blunders and artifacts?
- The filtering of blunders and omission of data due to quality considerations is a balancing act. If too little is data is filtered, poor data will remain in the DEM. If data filtering and removal is too aggressive, quality data is lost.
- Will there be more continuous updates?
- In July of 2023, NSF, NGA, and NRO announced an agreement with Maxar to establish an exception to EOCL for PGC’s ArcticDEM and Reference Elevation Model of Antarctica (REMA) projects. These derived products will remain available to the public until 2032. Annual DEM strip releases are scheduled for each calendar year from 2022-2032. See the main ArcticDEM, REMA and EarthDEM pages for details. Mosaic product releases are subject to available timing and funding.
Join the PGC Elevation Updates mailing list to receive release and other updates. - Why isn’t the data clipped to the coastline?
- Each one of the 2 meter posting DEM strips was collected over a number of years and has a date and time stamp. At this resolution coastlines, rivers, lakes, and many other types of features can change. If the data is clipped to a low resolution coastline or a coastline from a particular year, usable, relevant data may be lost.
- Why are lakes, rivers, and oceans portrayed inconsistently within the data (some as data voids, some flattened)?
- Due to the seasonal variation in source imagery acquisition, some waterbodies were frozen while others were open. Stereo auto-correlation becomes problematic over open water due to the changing surface conditions, so data voids in areas of open water can be expected. Water bodies that are frozen will often exist as data within the DEM files, depicted as relatively flat surfaces with varied degree of texture.
- What factors must I be aware of if the imagery was collected over multiple years and all seasons?
- Any factor you would consider when looking at high-resolution satellite imagery or air photography should be considered in PGC DEM products. These include snow cover, sea ice in coastal areas, and vegetation leaf-on/off condition.
- Is the source satellite imagery used to create the DEMs included?
- Source imagery is not provided due to licensing restrictions. Non-core PGC users interested in licensing the commercial imagery should contact Maxar.
- Why is there a discrepancy between tiles downloaded from the Explorer Apps/Web Services and the PGC website?
- The DEMs provided by PGC are relative to the WGS84 ellipsoid, whereas the Esri services have transformed those values to be in geoidal heights (EGM08) which more closely approximate mean sea level.
Disclaimer
From the PGC:
Neither the Polar Geospatial Center nor its employees or partners make any representations or warranties, express or implied, with respect to the use of or reliance on the data provided herewith, regardless of its format or means of transmission. There are no guarantees or representations to the user as to the accuracy, currency, completeness, suitability or reliability of this data for any purpose.
THE USER ACCEPTS THE DATA IS PROVIDED “AS IS” AND ASSUMES ALL RISKS ASSOCIATED WITH ITS USE.
Citations
Along with acknowledgement to PGC, you should cite PGC DEM datasets as follows:
ArcticDEM
Mosaics: Porter, Claire, et al., 2023, “ArcticDEM, Version 4.1”, https://doi.org/10.7910/DVN/3VDC4W, Harvard Dataverse, V1, [Date Accessed].
Strips: Porter, Claire, et al., 2022, “ArcticDEM – Strips, Version 4.1”, https://doi.org/10.7910/DVN/C98DVS, Harvard Dataverse, V1, [Date Accessed].
REMA
Mosaics: Howat, Ian, et al., 2022, “The Reference Elevation Model of Antarctica – Mosaics, Version 2”, https://doi.org/10.7910/DVN/EBW8UC, Harvard Dataverse, V1, [Date Accessed].
Strips: Howat, Ian, et al., 2022, “The Reference Elevation Model of Antarctica – Strips, Version 4.1”, https://doi.org/10.7910/DVN/X7NDNY, Harvard Dataverse, V1, [Date Accessed].
EarthDEM
Mosaics: Porter, Claire, et al., 2022, “EarthDEM – Mosaics, Version 1”, https://doi.org/10.7910/DVN/MVOWY7, Harvard Dataverse, V1, [Date Accessed].
Strips: Porter, Claire, et al., 2022, “EarthDEM – Strips, Version 1”, https://doi.org/10.7910/DVN/LHE9O7, Harvard Dataverse, V1, [Date Accessed].
Contributors
Thanks to our partners for their contributions to the ArcticDEM, REMA and EarthDEM projects:
Polar Geospatial Center, University of Minnesota
Byrd Polar research Center, The Ohio State University
The Ohio Supercomputing Center
The National Center for Supercomputing Applications, University of Illinois at Urbana-Champaign
The Texas Advanced Computing Center, University of Texas at Austin
National Science Foundation
National Geospatial-Intelligence Agency
ESRI
Amazon Web Services Open Data Sponsorship Program
Contact
Questions, comments and corrections regarding ArcticDEM, REMA, and EarthDEM can be directed to the Polar Geospatial Center. Send Message
Leave a Reply
You must be logged in to post a comment.